Fig. 3
Download original image
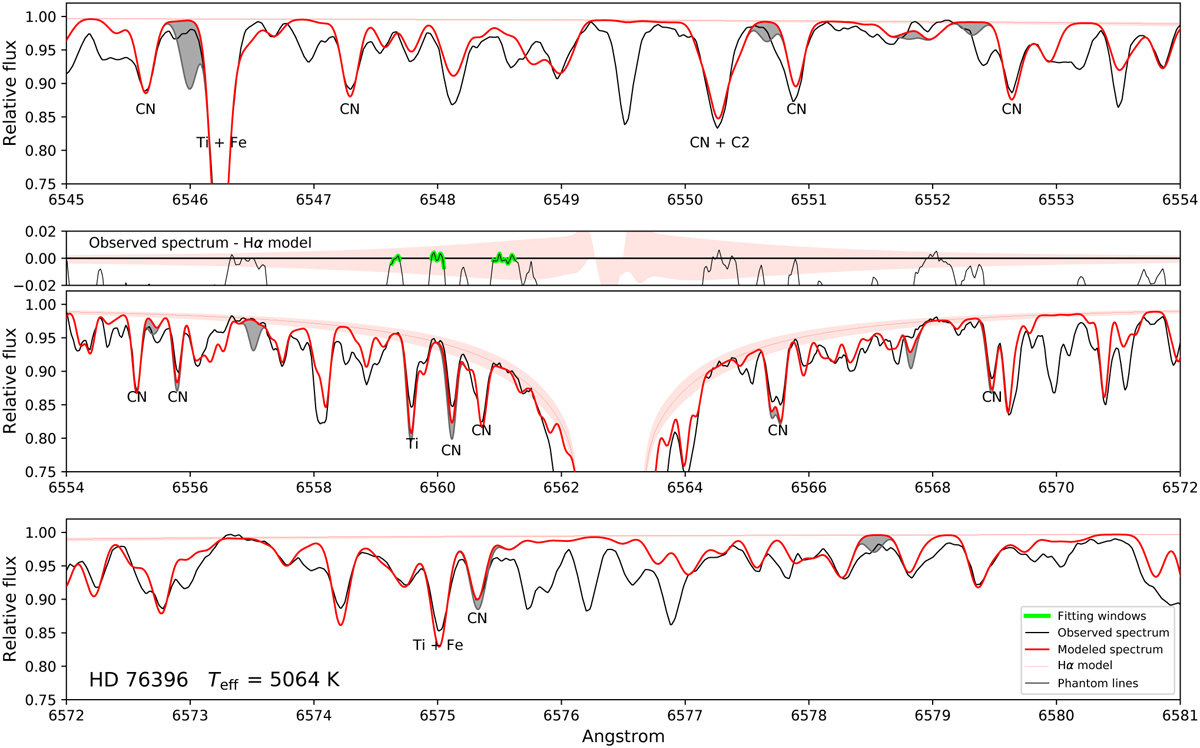
Observed spectra of the CEMP star HD 76396 compared with its modelled spectra. The upper and lower panels are used to ensure that a proper normalisation of the observed spectrum is performed in the Hα region illustrated in the middle panel. Pink shades represent variations of up to ±200 K, providing a view of the flux sensitivity to Teff along the wavelength range. Grey shades indicate transitions not appearing in the observational spectrum, which were eliminated from the synthesis line lists, according to the procedure described in Giribaldi & Smiljanic (2023a). The fitting windows used are highlighted in green in the residual plot in the second panel. Some atomic and molecular characteristics are labelled in the plots.
Current usage metrics show cumulative count of Article Views (full-text article views including HTML views, PDF and ePub downloads, according to the available data) and Abstracts Views on Vision4Press platform.
Data correspond to usage on the plateform after 2015. The current usage metrics is available 48-96 hours after online publication and is updated daily on week days.
Initial download of the metrics may take a while.