Fig. 5.
Download original image
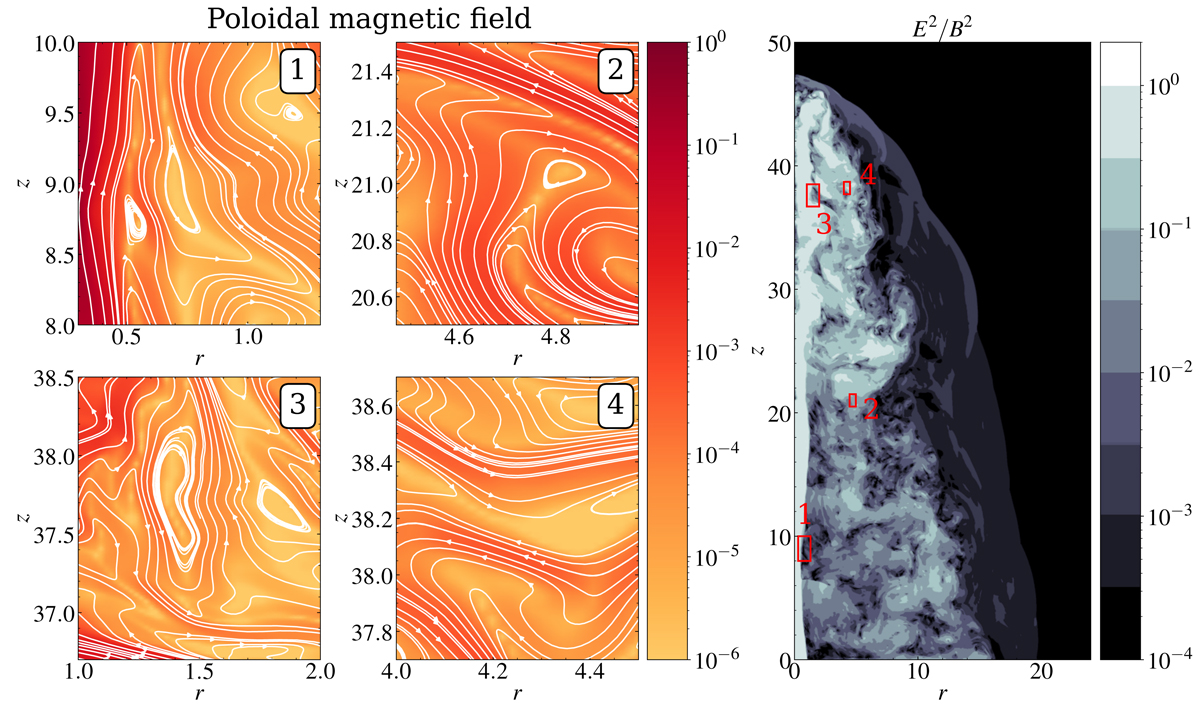
Current sheet forming in the turbulent jet region for the case η = 10−3 at t = 300. The right panel shows the ratio between the electric and magnetic components of the electromagnetic energy. The four left panels show zoomed-in portions of the jet domain (see the rectangles in the right plot), where the poloidal magnetic field (color) and magnetic field lines (white lines) are plotted in order to highlight the reversal of the magnetic field and the formation of magnetic islands due to magnetic reconnection.
Current usage metrics show cumulative count of Article Views (full-text article views including HTML views, PDF and ePub downloads, according to the available data) and Abstracts Views on Vision4Press platform.
Data correspond to usage on the plateform after 2015. The current usage metrics is available 48-96 hours after online publication and is updated daily on week days.
Initial download of the metrics may take a while.