Fig. A.1.
Download original image
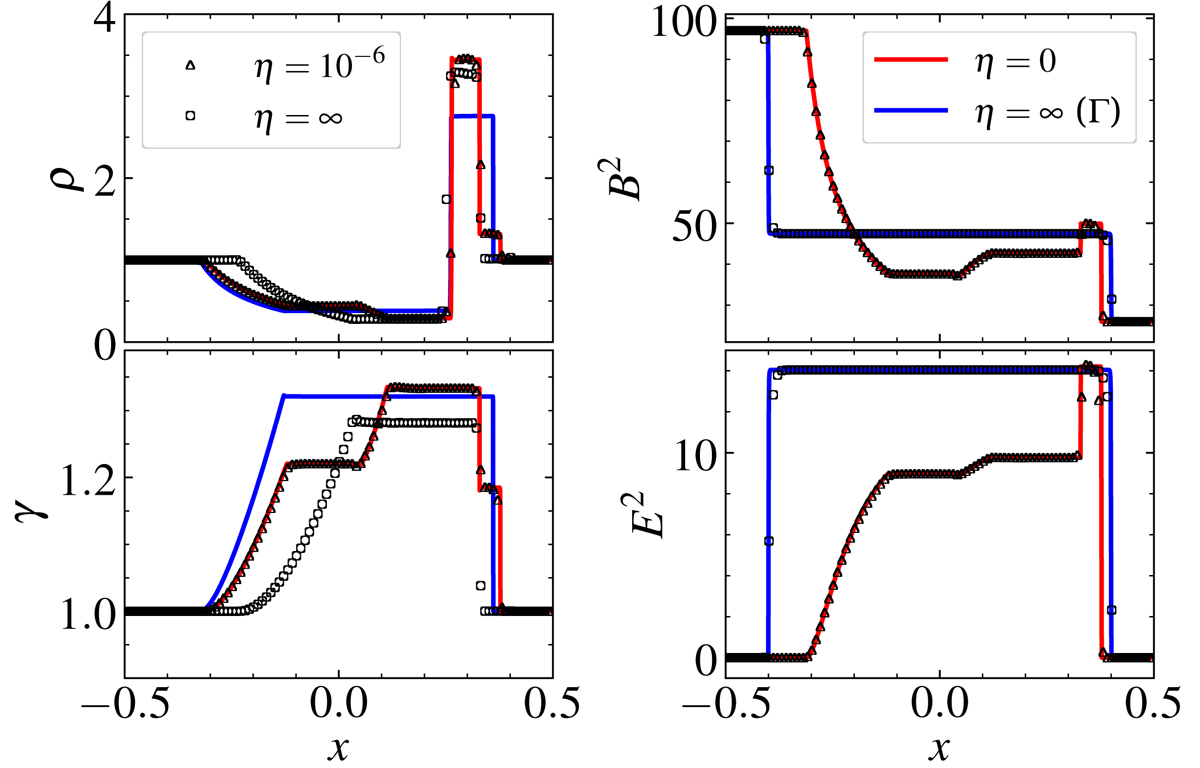
ST1: comparison of fluid and electromagnetic quantities. On the left panels are shown the fluid density (top) and the Lorentz factor (bottom), while on the right panel the squared norms of the magnetic (top) and electric (bottom) fields are shown. The solid lines represent the reference simulation in the ideal (red) and frozen (blue) limits, respectively, while the test simulations are shown through triangles (ideal limit) and circles (frozen limit).
Current usage metrics show cumulative count of Article Views (full-text article views including HTML views, PDF and ePub downloads, according to the available data) and Abstracts Views on Vision4Press platform.
Data correspond to usage on the plateform after 2015. The current usage metrics is available 48-96 hours after online publication and is updated daily on week days.
Initial download of the metrics may take a while.