Fig. 6.
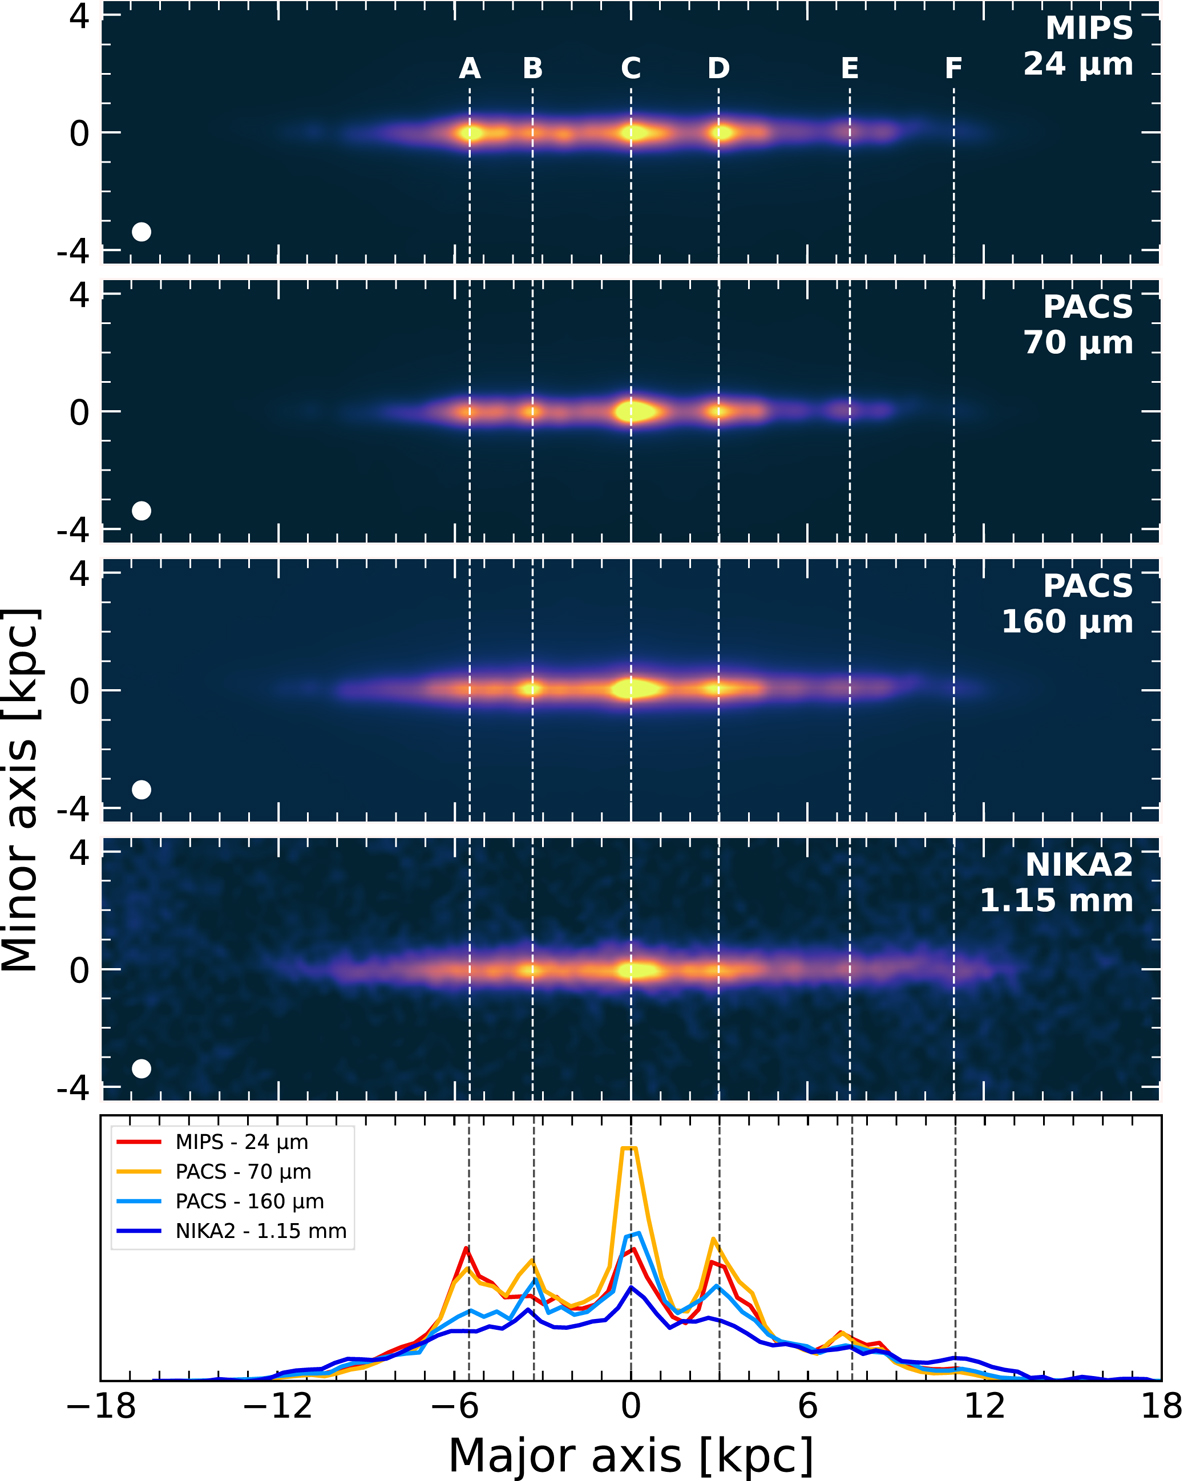
Download original image
Distribution of different dust components as traced by the MIPS − 24 μm, the PACS − 70 μm, the PACS − 160 μm, and the NIKA2 − 1.15 mm (top to bottom panels, respectively) convolved at an FWHM of 12″. The profiles along the major axis are plotted in the bottom panel. All profiles are normalized at 6 kpc. The vertical dotted lines indicate the positions of interest introduced in Fig. 2. The colors were scaled in such a way as to detail the disk morphology and not the extended emission above the plane.
Current usage metrics show cumulative count of Article Views (full-text article views including HTML views, PDF and ePub downloads, according to the available data) and Abstracts Views on Vision4Press platform.
Data correspond to usage on the plateform after 2015. The current usage metrics is available 48-96 hours after online publication and is updated daily on week days.
Initial download of the metrics may take a while.