Fig. 3.
Download original image
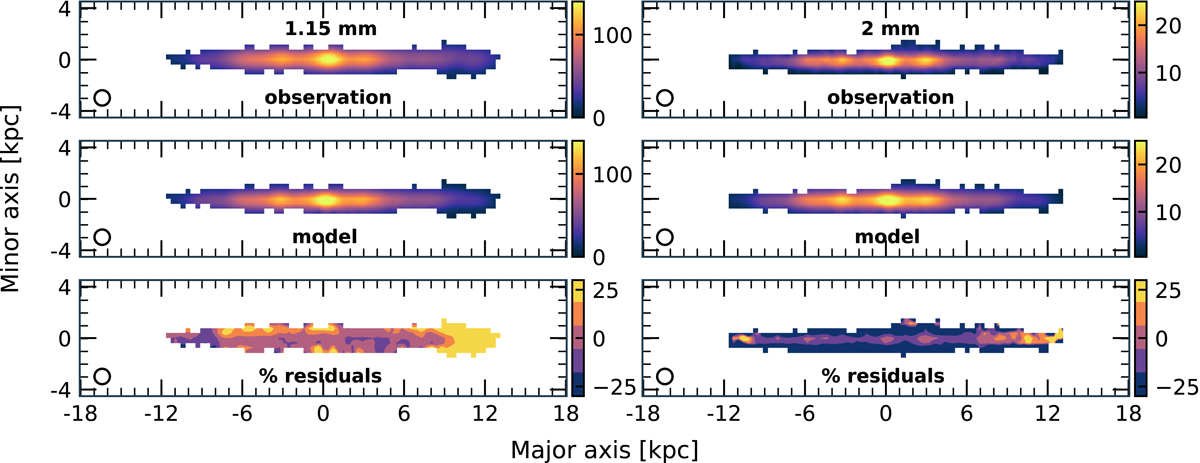
Observed and modeled maps (top and middle panels, respectively) at 1.15 and 2 mm (left and right panels, respectively). The maps are displayed in linear brightness scale. The brightness levels are indicated in the color bars on the right in each panel in units of mJy per 25″ beam. The bottom panels indicate the percentage residuals between observation and model at both wavelengths. All maps are at a common resolution of 25″, as indicated by the circle in the bottom left corner in each panel.
Current usage metrics show cumulative count of Article Views (full-text article views including HTML views, PDF and ePub downloads, according to the available data) and Abstracts Views on Vision4Press platform.
Data correspond to usage on the plateform after 2015. The current usage metrics is available 48-96 hours after online publication and is updated daily on week days.
Initial download of the metrics may take a while.