Fig. A.1
Download original image
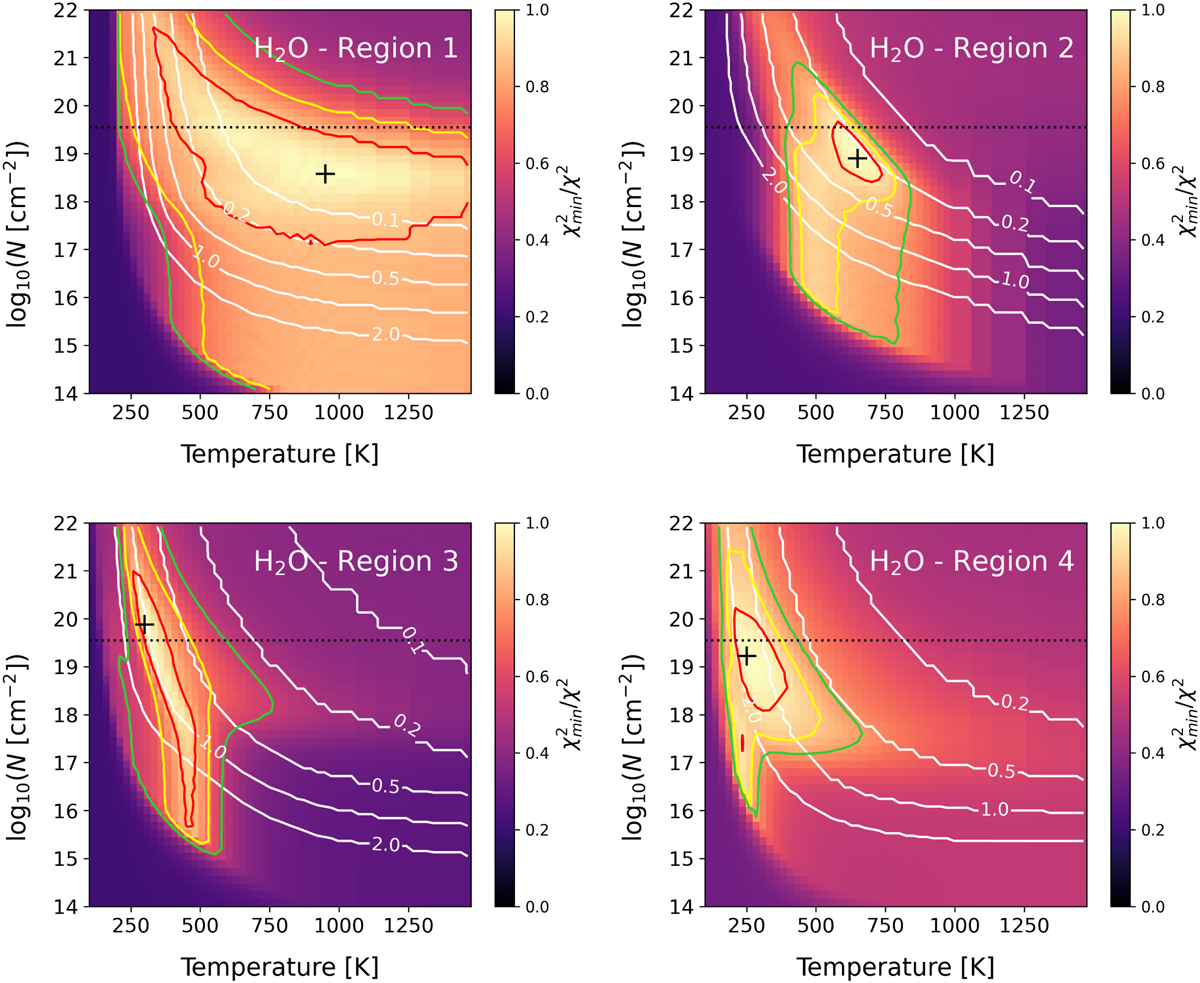
χ2 plots of H2O over the different regions of the disk (top left: region 1, top right: region 2, bottom left: region 3, bottom right: region 4). The red, yellow, and green lines indicate the 1σ, 2σ, and 3σ confidence contours, respectively. The white contours show the emitting radii in astronomical units (0.1 to 2.0 au). The black cross corresponds to the best fit. The black dotted line corresponds to the upper limit of the column density based on the H218O and H216O flux ratio as described in Sect. 3.1.
Current usage metrics show cumulative count of Article Views (full-text article views including HTML views, PDF and ePub downloads, according to the available data) and Abstracts Views on Vision4Press platform.
Data correspond to usage on the plateform after 2015. The current usage metrics is available 48-96 hours after online publication and is updated daily on week days.
Initial download of the metrics may take a while.