Fig. 2
Download original image
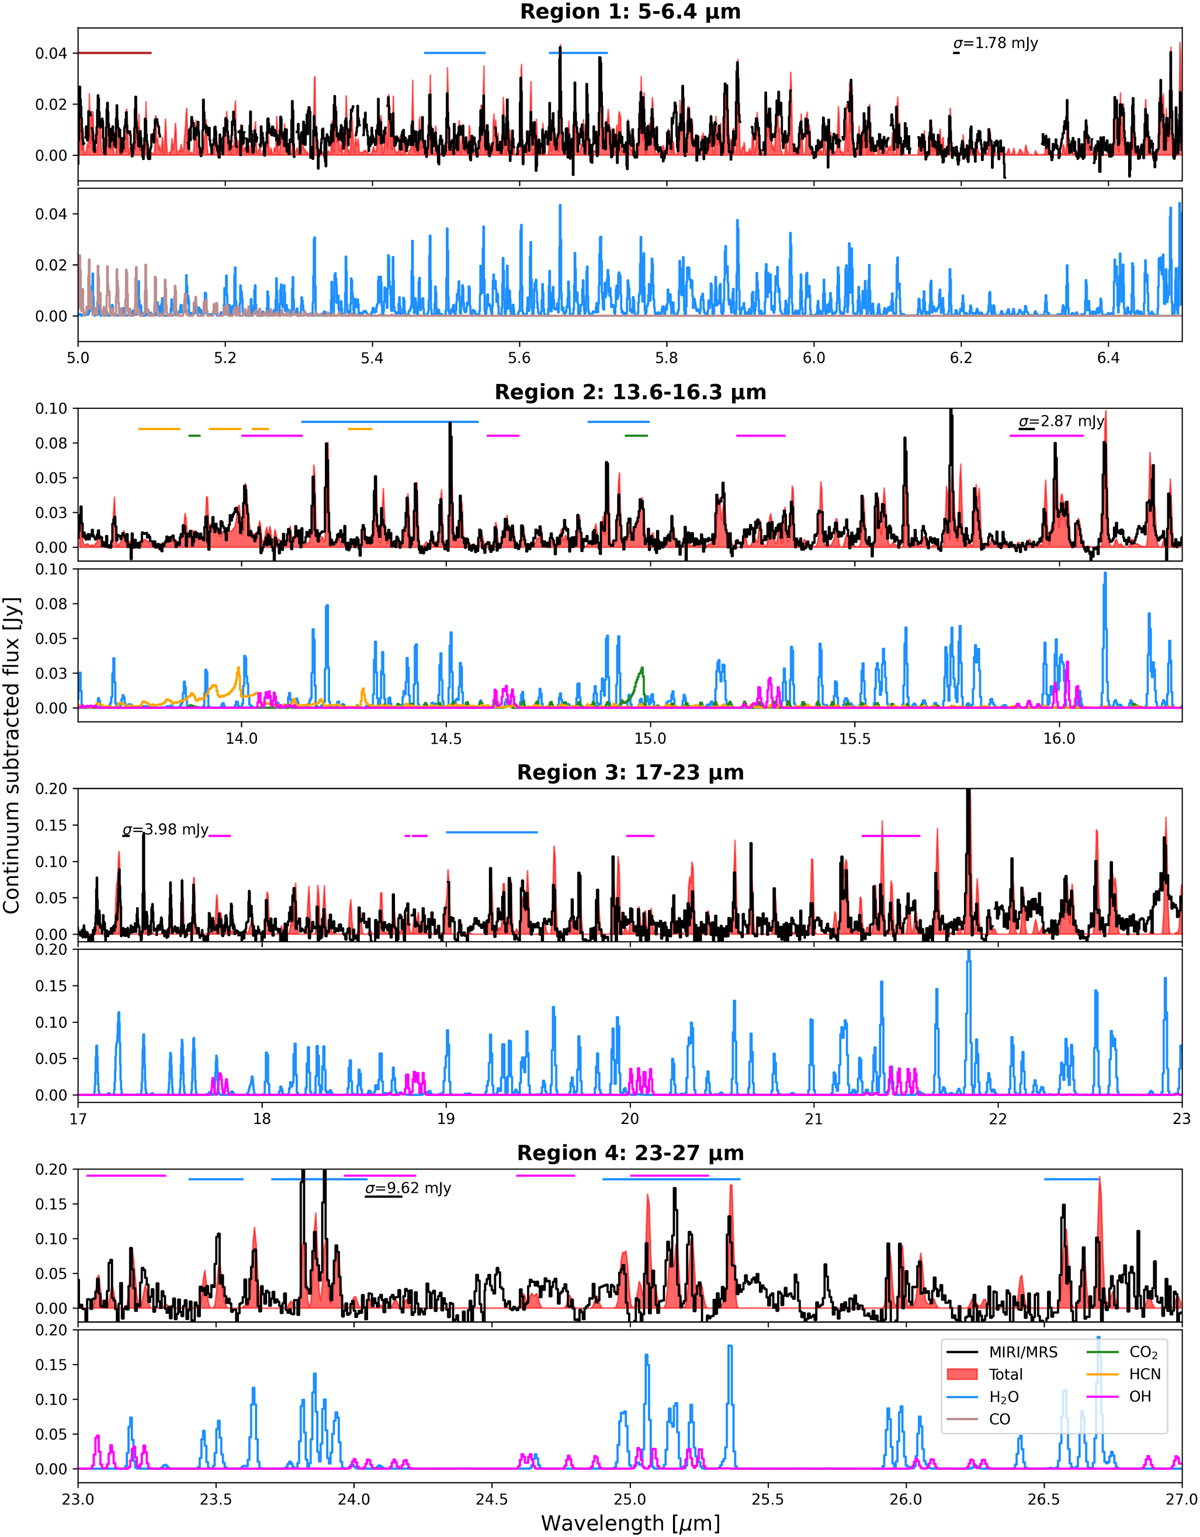
Slab fits for the four different wavelength ranges. The top and bottom panels per region are the data and total model, and the individual slab models; respectively. Spurious spikes and features from the data reduction have been blanked out (see the list in Appendix B). The horizontal lines indicate the regions used to fit the molecules, or the region where σ is estimated after subtracting the slab models.
Current usage metrics show cumulative count of Article Views (full-text article views including HTML views, PDF and ePub downloads, according to the available data) and Abstracts Views on Vision4Press platform.
Data correspond to usage on the plateform after 2015. The current usage metrics is available 48-96 hours after online publication and is updated daily on week days.
Initial download of the metrics may take a while.