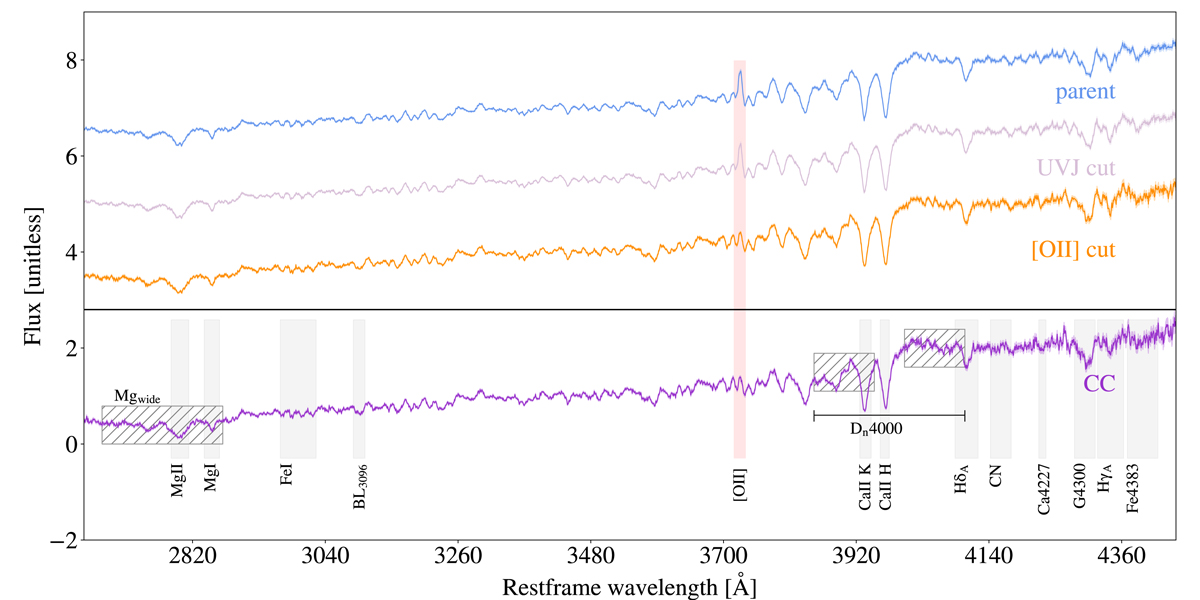
Fig. 3.
Download original image
Median stacked spectra estimated for the different incremental selected samples of our analysis, as described in Sect. 2.2. We underline that the final sample considered is the purple one, on which we also highlight the most characteristic absorption features (grey shaded area) and spectral breaks (dashed area), as well as the position of potential emission lines (red shaded area), showing the absence of emission lines in our final sample.
Current usage metrics show cumulative count of Article Views (full-text article views including HTML views, PDF and ePub downloads, according to the available data) and Abstracts Views on Vision4Press platform.
Data correspond to usage on the plateform after 2015. The current usage metrics is available 48-96 hours after online publication and is updated daily on week days.
Initial download of the metrics may take a while.