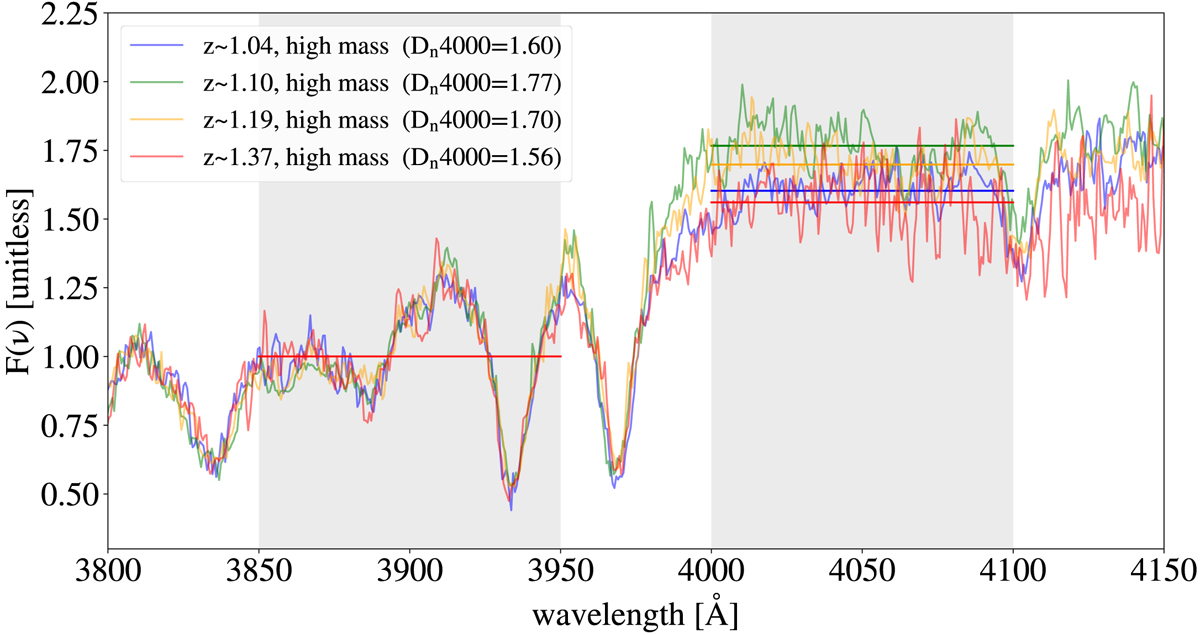
Fig. A.2.
Download original image
Median stacked spectra obtained for the high-mass sample in each of the four redshift bins, normalised to their mean value in the blue band of the Dn4000. In grey, we show the two windows in which the red and blue bands of the Dn4000 are defined, while horizontal lines represent their median values in these two ranges. We remind the reader that the median spectra have been normalised in the blue window; therefore, the average fluxes of the four spectra in that region are identical by definition.
Current usage metrics show cumulative count of Article Views (full-text article views including HTML views, PDF and ePub downloads, according to the available data) and Abstracts Views on Vision4Press platform.
Data correspond to usage on the plateform after 2015. The current usage metrics is available 48-96 hours after online publication and is updated daily on week days.
Initial download of the metrics may take a while.