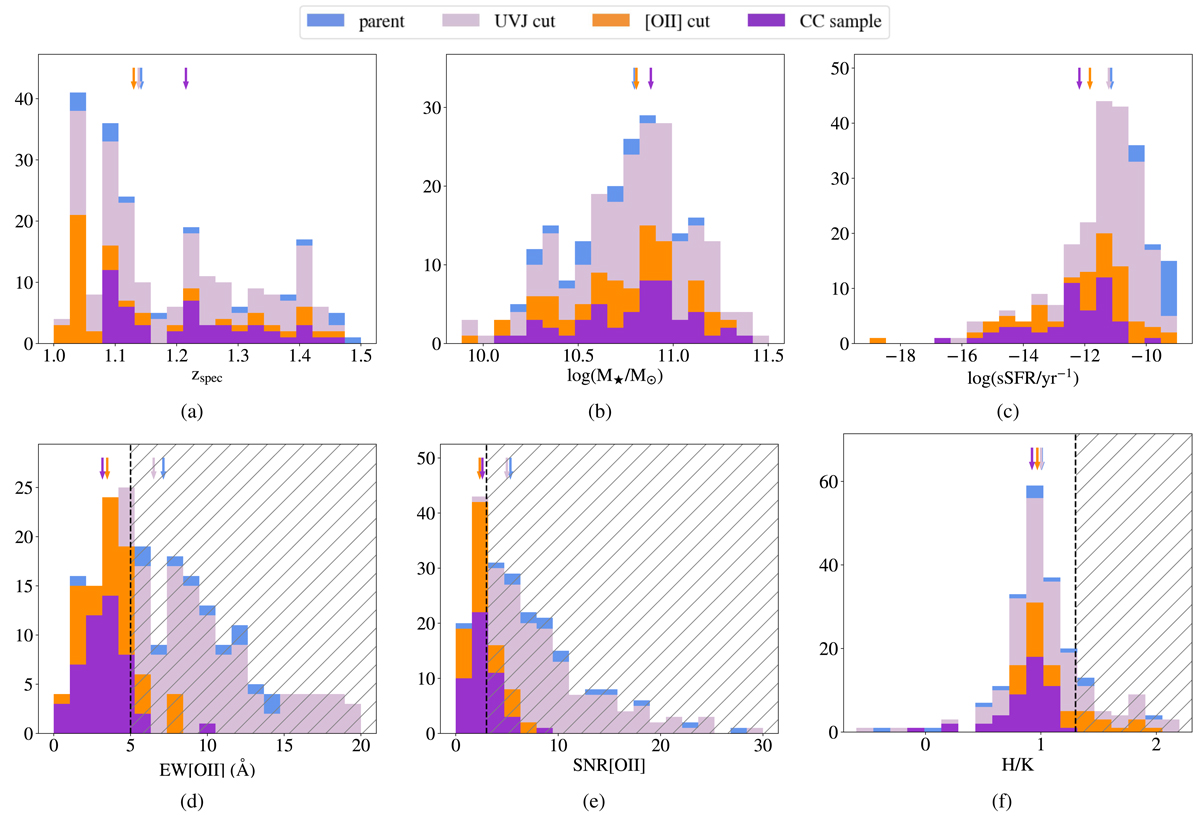
Fig. 1.
Download original image
Histograms for the physical and spectral properties of the samples in each selection step, as shown in the legend and described in Sect. 2.2. Vertical arrows represent the corresponding median values, and, when present, the dashed vertical line indicates the threshold value adopted to select cosmic chronometers according to that quantity (the shaded area showing the discarded range). We note that for the [OII] we adopted a conservative cut, discarding only the objects that showed both EW([OII]) > 5 Å and S/N([OII]) > 3, aiming to keep objects in which the [OII] line could be due to noise fluctuation.
Current usage metrics show cumulative count of Article Views (full-text article views including HTML views, PDF and ePub downloads, according to the available data) and Abstracts Views on Vision4Press platform.
Data correspond to usage on the plateform after 2015. The current usage metrics is available 48-96 hours after online publication and is updated daily on week days.
Initial download of the metrics may take a while.