Fig. 4.
Download original image
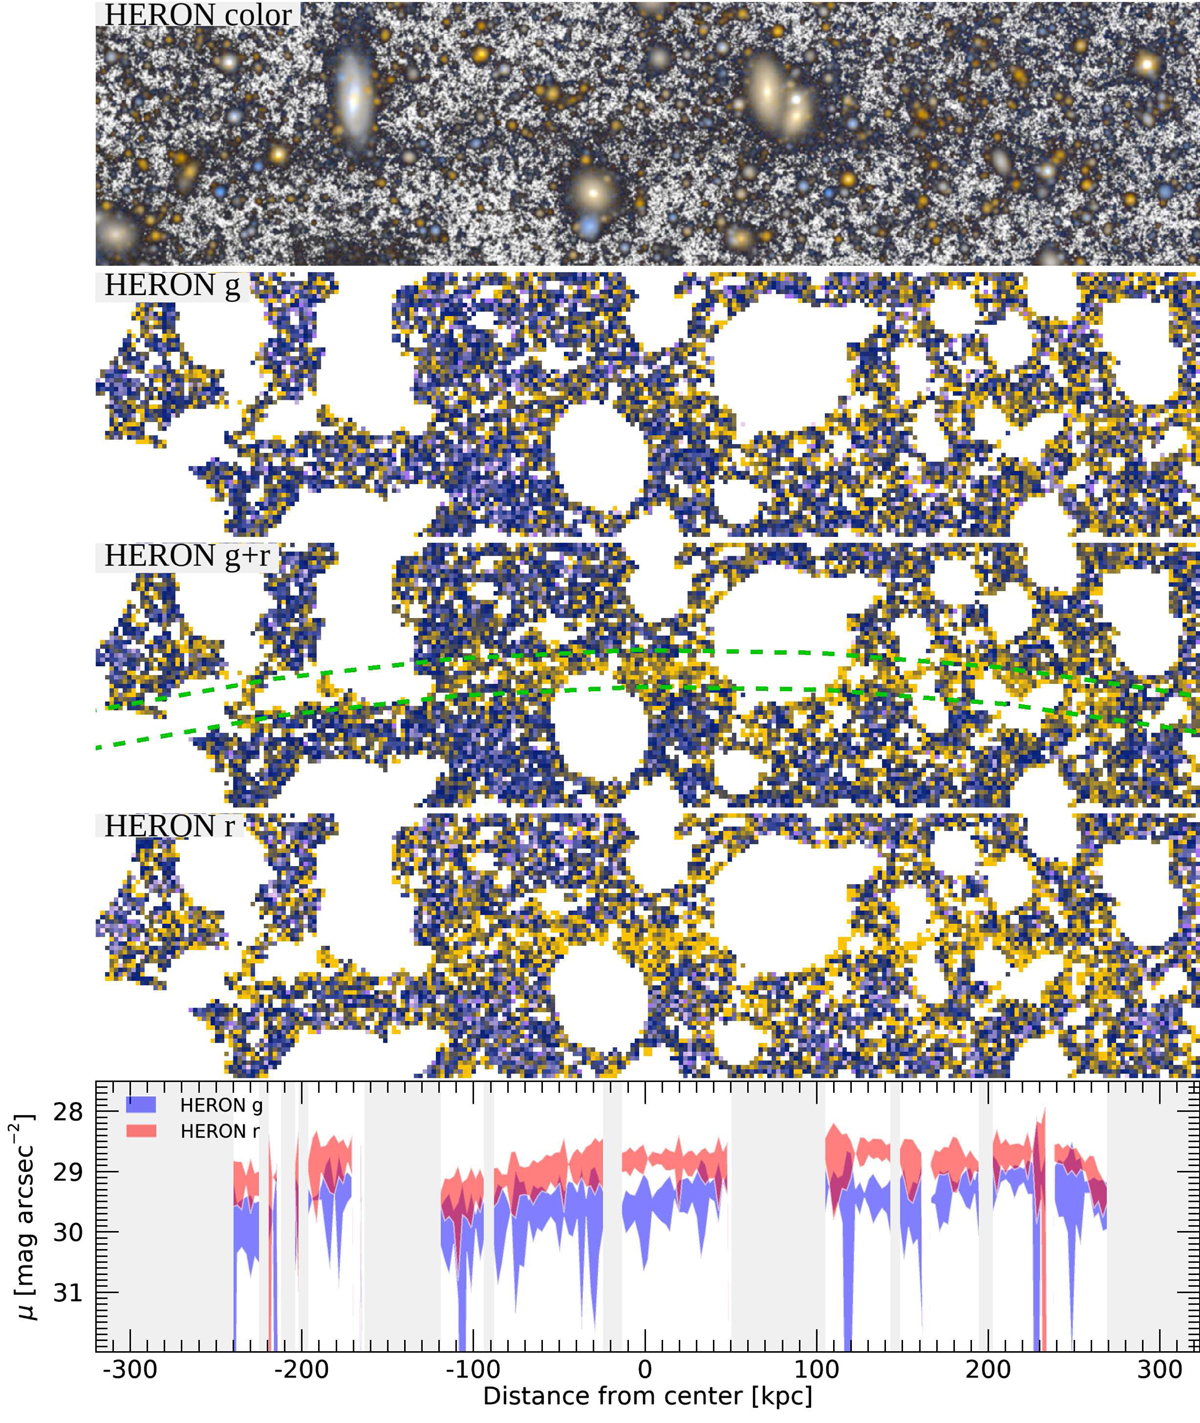
Images and photometric profiles with HERON data. Top panel: composite color image with HERON in g and r bands. The high-contrast gray background is constructed with the sum g + r image. Middle panels: high-contrast images in the same field as the top panel in g, g + r, and r. Sources external to the stream were masked and the image was then rebinned to 5 × 5 pixels. The region bound by green dashed lines in the g + r image marks the position of the stream. Bottom panel: surface brightness profiles of the stream along the aperture indicated in the g + r image. HERON g and r bands are shown in blue and red, respectively, with an error of 1σ. Gray regions are spatial locations along the stream, which are discarded due to the absence of signal produced by the masking from external sources.
Current usage metrics show cumulative count of Article Views (full-text article views including HTML views, PDF and ePub downloads, according to the available data) and Abstracts Views on Vision4Press platform.
Data correspond to usage on the plateform after 2015. The current usage metrics is available 48-96 hours after online publication and is updated daily on week days.
Initial download of the metrics may take a while.