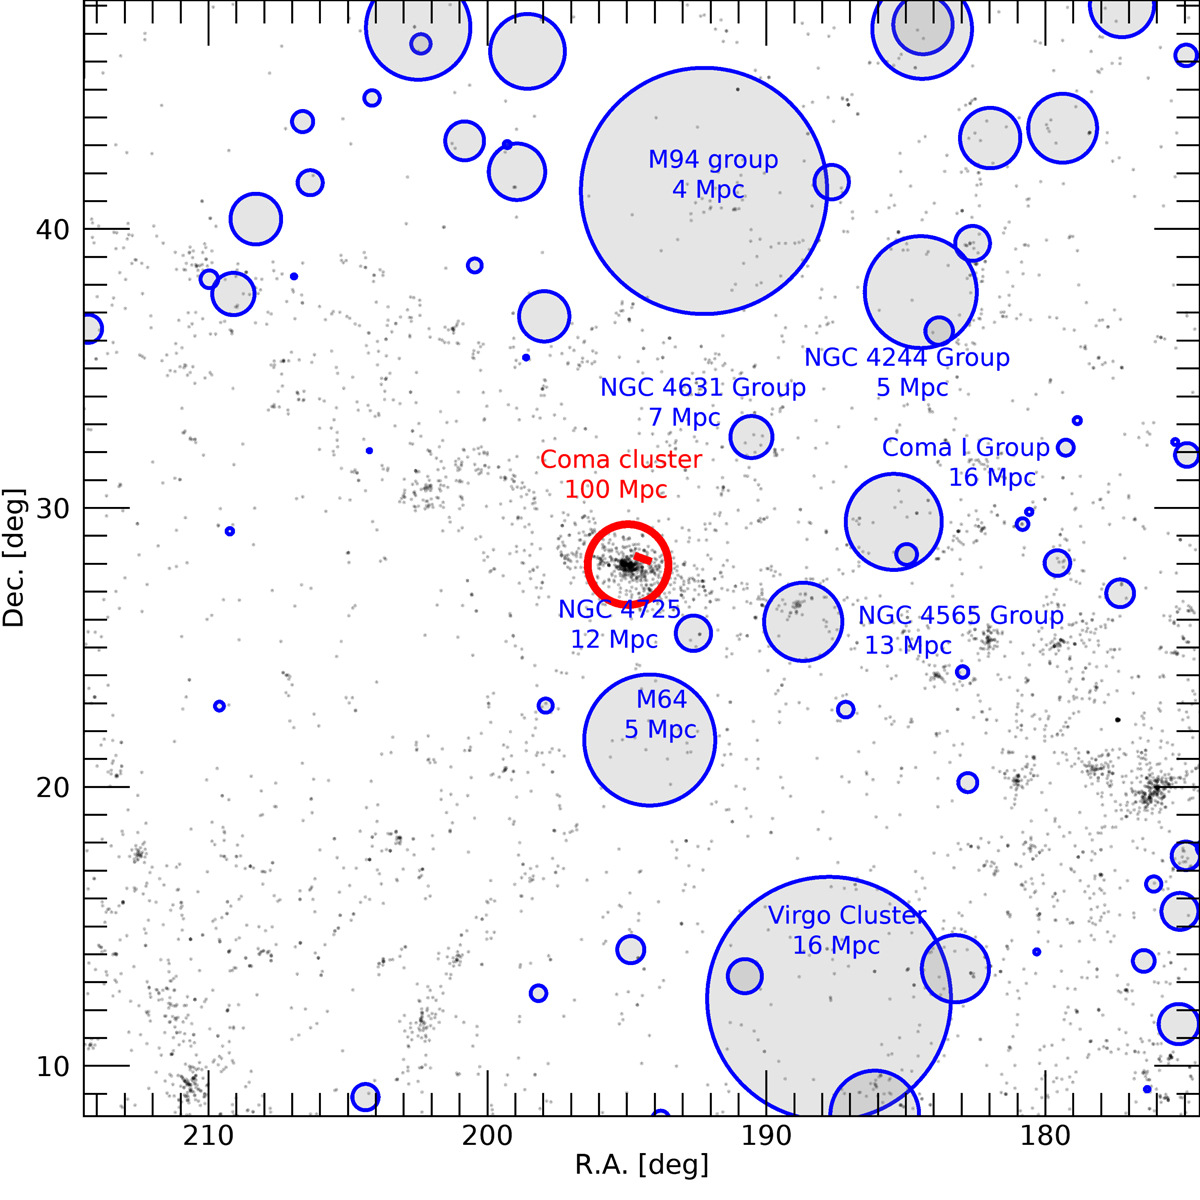
Fig. 3.
Download original image
Graphical representation of galactic associations in the line of sight of the Giant Coma Stream. Groups and clusters of local galaxies (Vrad < 3500 km s−1) and their apparent virial radii are represented with gray circles. Galaxies with redshift in the range of 3500 km s−1 < Vrad < 10 000 km s−1 are represented with black dots. The apparent Coma virial radius is represented with a red circle. The position and longitude of the Giant Coma Stream is represented with a red segment.
Current usage metrics show cumulative count of Article Views (full-text article views including HTML views, PDF and ePub downloads, according to the available data) and Abstracts Views on Vision4Press platform.
Data correspond to usage on the plateform after 2015. The current usage metrics is available 48-96 hours after online publication and is updated daily on week days.
Initial download of the metrics may take a while.