Fig. 2.
Download original image
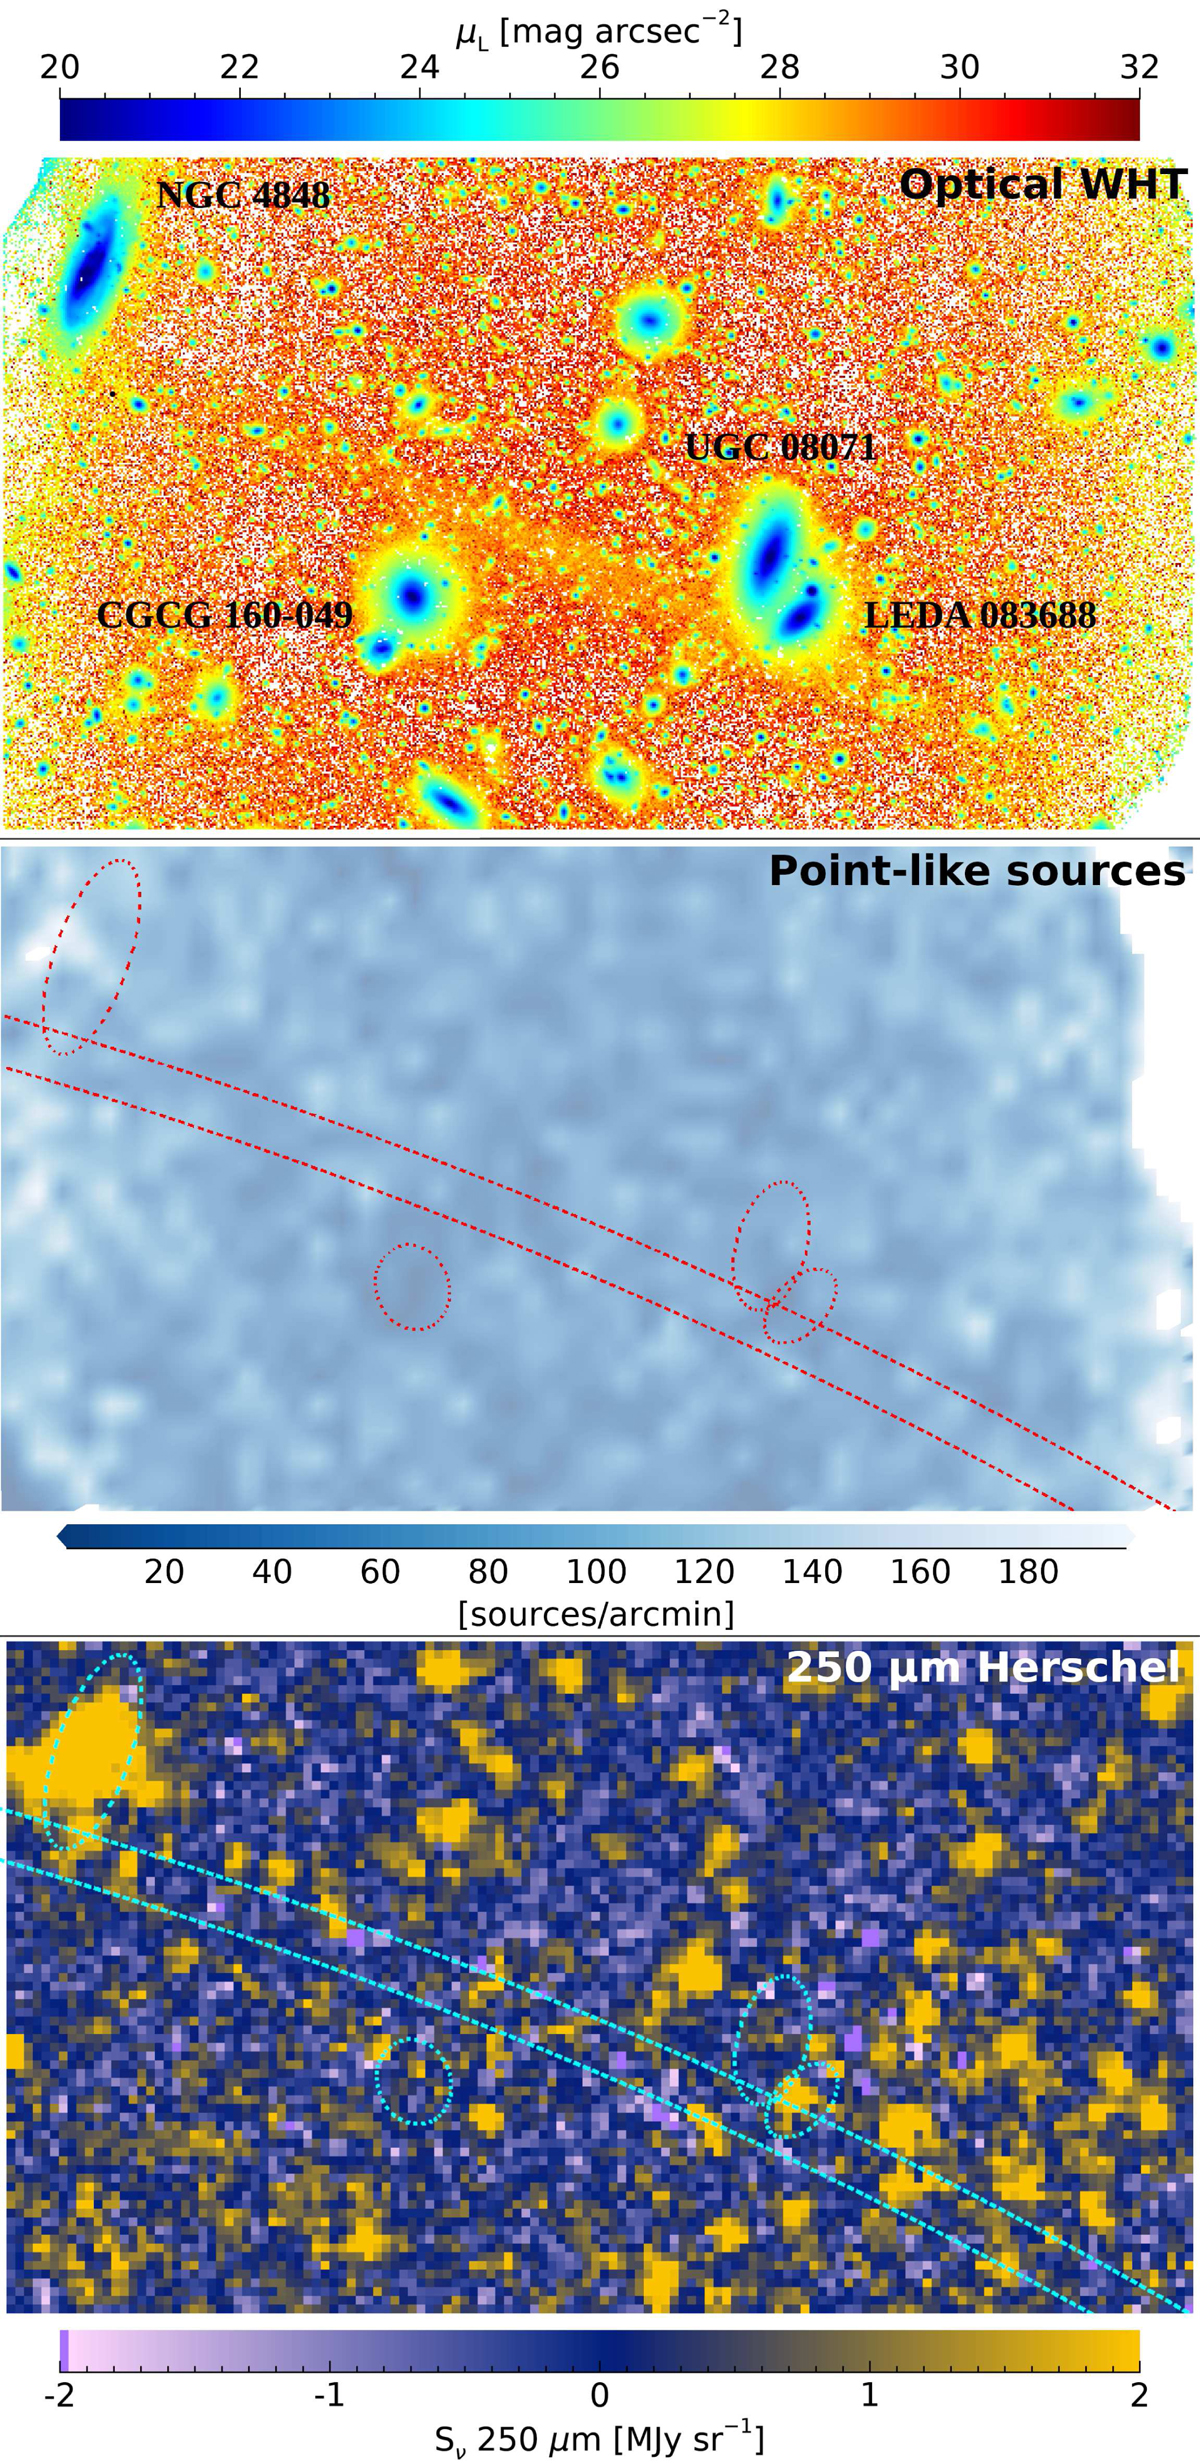
Comparison between optical point-like source density and far-IR emission in the central region (13.5 × 7.6 arcmin). Top panel: WHT image in the luminance L filter color coded in surface brightness according to the upper color bar. Middle panel: density of detected point-like sources in the region with WHT data. Lower panel: 250 μm counterpart with the Herschel space telescope. The image is color coded in Sν according to the lower color bar. The dashed lines mark elliptical surface brightness contours of approximately μL = 26 mag arcsec−2 for the galaxies named in the top panel, and μL = 29.5 mag arcsec−2 for the location of the Giant Coma Stream.
Current usage metrics show cumulative count of Article Views (full-text article views including HTML views, PDF and ePub downloads, according to the available data) and Abstracts Views on Vision4Press platform.
Data correspond to usage on the plateform after 2015. The current usage metrics is available 48-96 hours after online publication and is updated daily on week days.
Initial download of the metrics may take a while.