Fig. 8.
Download original image
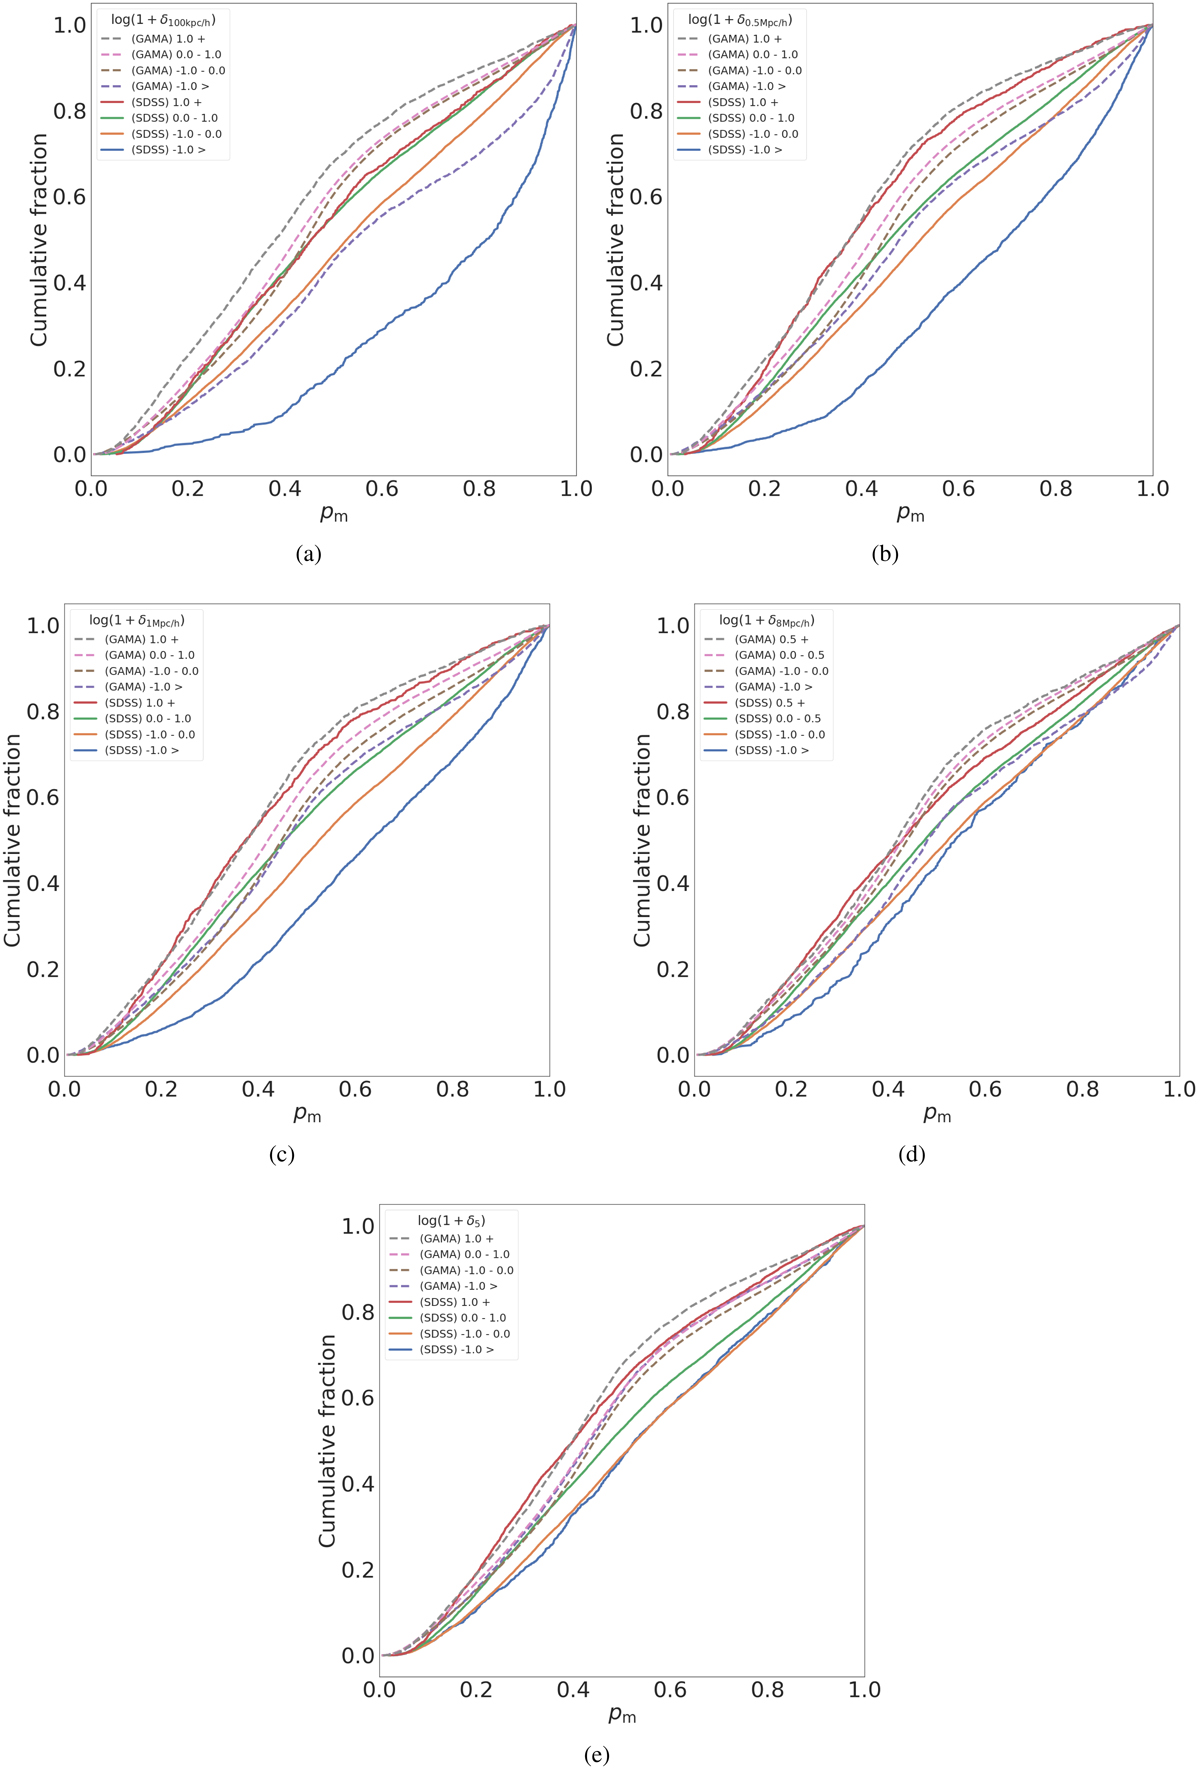
Cumulative distribution curves of merger probabilities of HSC galaxies cross-matched with GAMA (dotted lines) and SDSS (solid lines) predicted by our fine-tuned model, for environmental densities at differing apertures. log(1 + δ5) Each curve represents a different environmental density bin. The gradients of these curves show that in lower density environments, there are more higher merger probability galaxies, and in higher density environments, there are more galaxies with lower merger probabilities. This trend holds true for each parameter investigated. The trend also holds qualitatively between the SDSS and GAMA samples. The environmental parameters are as follows, and we also indicate the KS test statistic between the densest and least dense regions in each figure as reference. Upper left panel: 0.1 h−1 Mpc stellar mass overdensity log(1 + δ0.1 h−1 Mpc), KS test (SDSS) statistic: 0.394, KS test (GAMA) statistic: 0.238. Upper right panel: 0.5 h−1 Mpc stellar mass overdensity log(1 + δ0.5 h−1 Mpc), KS test (SDSS) statistic: 0.417, KS test (GAMA) statistic: 0.184. Middle left panel: 1 h−1 Mpc stellar mass overdensity log(1 + δ1 h−1 Mpc), KS test (SDSS) statistic: 0.341, KS test (GAMA) statistic: 0.143. Middle right panel: 8 h−1 Mpc stellar mass overdensity log(1 + δ8 h−1 Mpc), KS test (SDSS) statistic: 0.183, KS test (GAMA) statistic: 0.127. Bottom panel: fifth nearest neighbor mass overdensity, KS test (SDSS) statistic: 0.191, KS test (GAMA) statistic: 0.069.
Current usage metrics show cumulative count of Article Views (full-text article views including HTML views, PDF and ePub downloads, according to the available data) and Abstracts Views on Vision4Press platform.
Data correspond to usage on the plateform after 2015. The current usage metrics is available 48-96 hours after online publication and is updated daily on week days.
Initial download of the metrics may take a while.