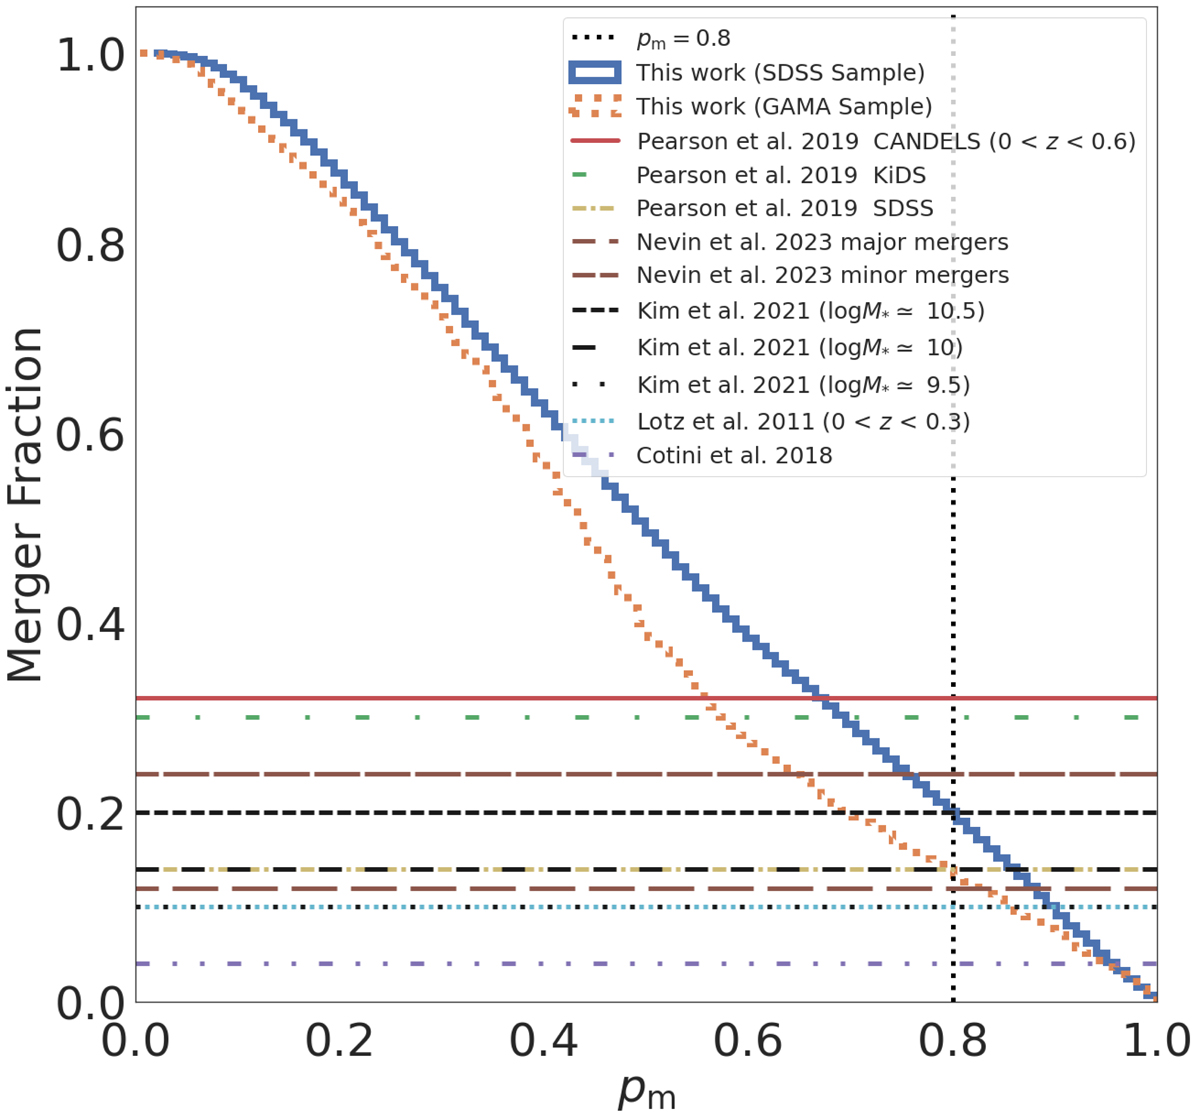
Fig. 7.
Download original image
Merger fraction as a function of merger probability for our two samples. The black vertical dotted line indicates the “confident” merger probability threshold of 0.8. We also plot the merger fractions found in Pearson et al. (2019b, red, green, and yellow lines), Nevin et al. (2023, brown lines), Kim et al. (2021, black lines), Lotz et al. (2011, light blue dotted line), and Cotini et al. (2013, purple line). We find that our merger fraction matches those of previous studies at increased merger probabilities.
Current usage metrics show cumulative count of Article Views (full-text article views including HTML views, PDF and ePub downloads, according to the available data) and Abstracts Views on Vision4Press platform.
Data correspond to usage on the plateform after 2015. The current usage metrics is available 48-96 hours after online publication and is updated daily on week days.
Initial download of the metrics may take a while.