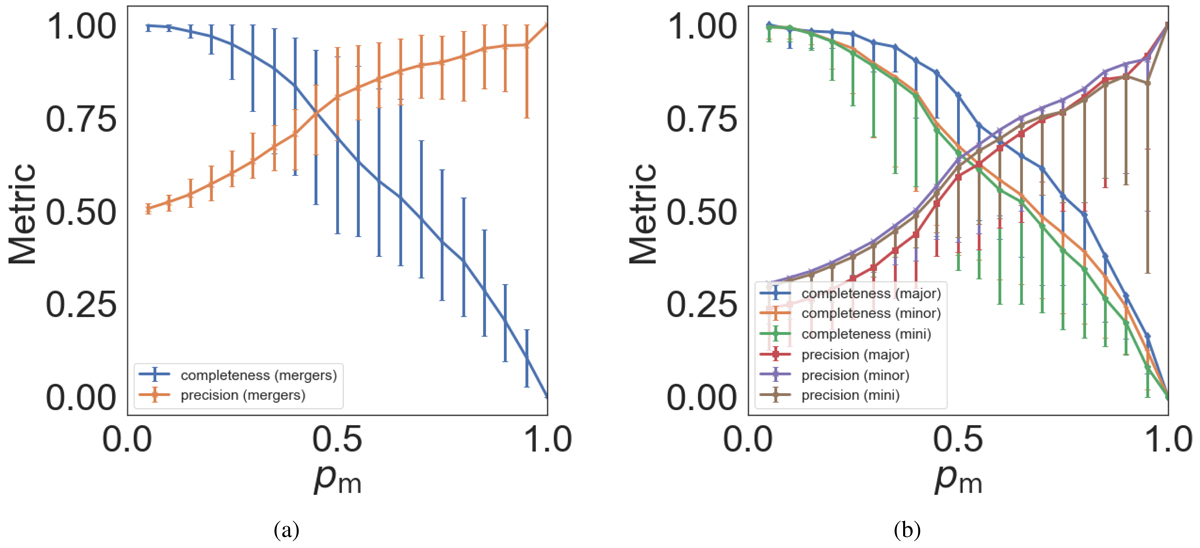
Fig. 4.
Download original image
Precision and completeness curves of the TNG images, with mean completeness and prevision as a function of merger probability. Left panel: curves assuming a complete binary split. The blue curve indicates completeness, and the orange curve indicates precision. Vertical error bars indicate the maximum and minimum values for the metric from the ten runs at each probability bin. Right panel: curves taking into consideration differing merger mass ratios (major, minor, mini). We find mini and minor mergers are predicted at an equivalent, if not greater precision compared to major mergers. We also find that the completeness at any fixed merger probability decreases with decreasing merger mass ratio.
Current usage metrics show cumulative count of Article Views (full-text article views including HTML views, PDF and ePub downloads, according to the available data) and Abstracts Views on Vision4Press platform.
Data correspond to usage on the plateform after 2015. The current usage metrics is available 48-96 hours after online publication and is updated daily on week days.
Initial download of the metrics may take a while.