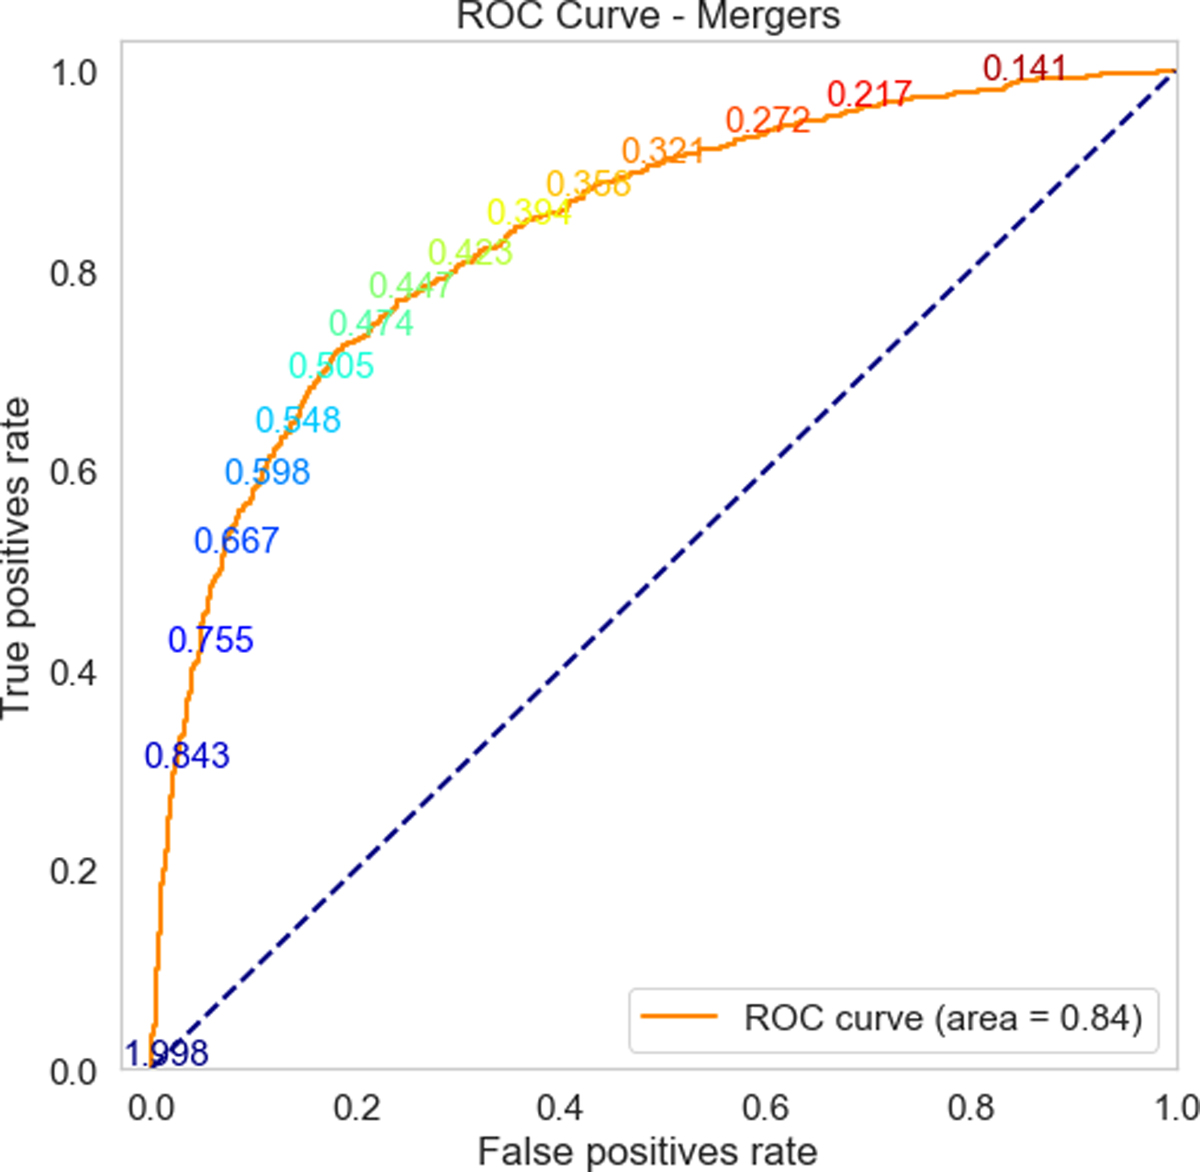
Fig. 3.
Download original image
Trained model’s ROC curve. The numbers overlayed on the curve indicate thresholds where the false positive and true positive rates along the curve are recorded. The dotted diagonal line is the performance of a completely random model that outputs a random probability for any image. An ROC curve is preferred to be above this dotted diagonal, and the curve generated from our model is above this line. We also find an AUC value of 0.84.
Current usage metrics show cumulative count of Article Views (full-text article views including HTML views, PDF and ePub downloads, according to the available data) and Abstracts Views on Vision4Press platform.
Data correspond to usage on the plateform after 2015. The current usage metrics is available 48-96 hours after online publication and is updated daily on week days.
Initial download of the metrics may take a while.