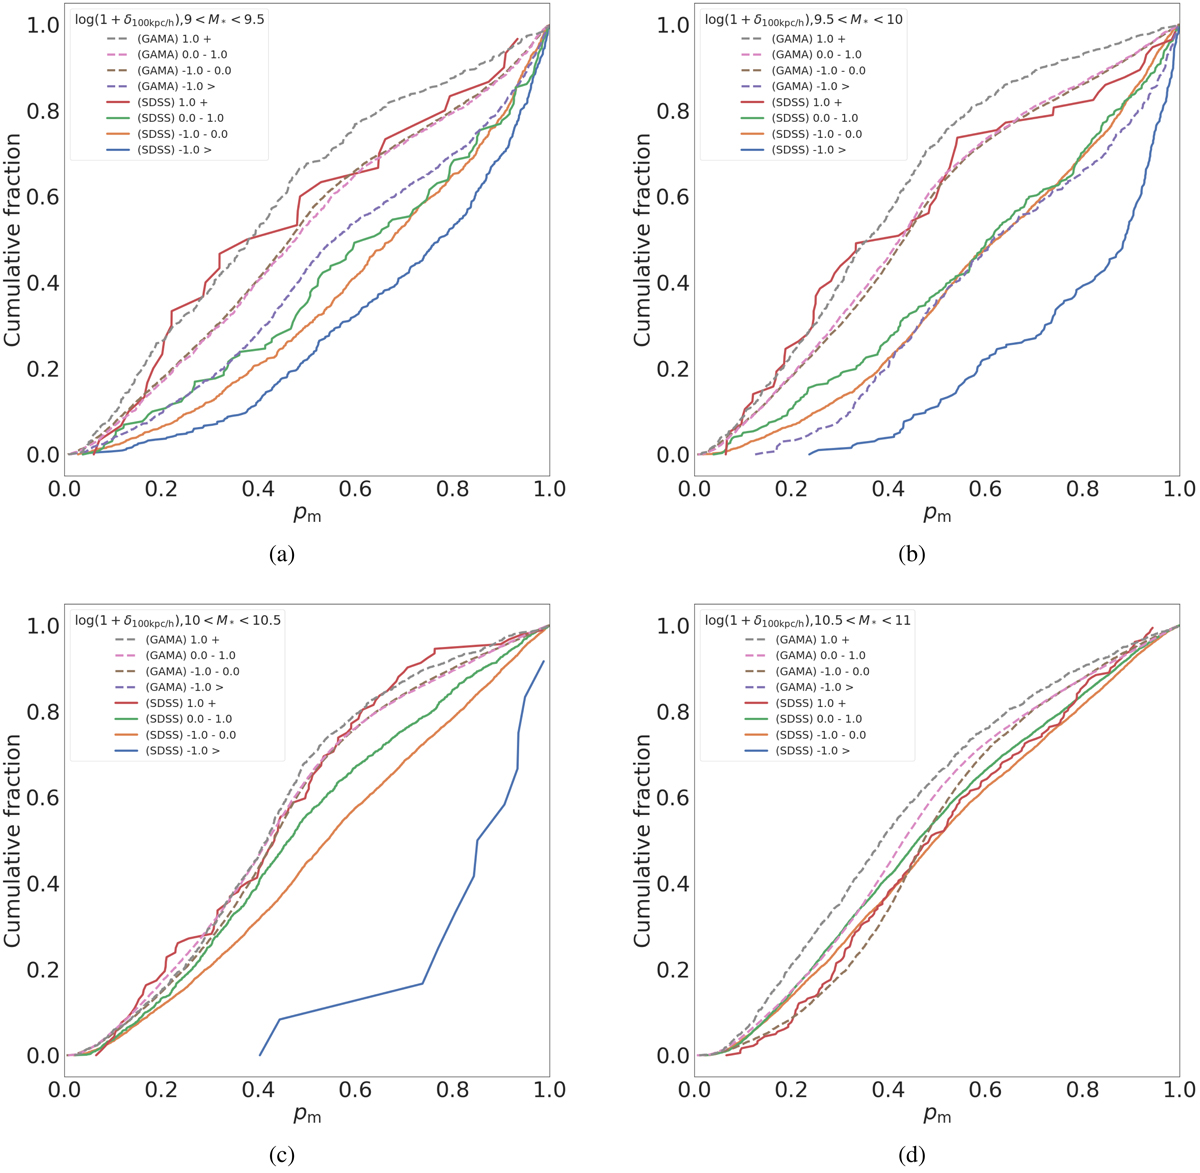
Fig. D.1.
Download original image
Cumulative distribution curves of merger probabilities of HSC galaxies cross-matched with GAMA (dotted lines) and SDSS (solid lines) predicted by our fine-tuned model, similar to Fig. 8, but separated into different mass bins. The KS test statistic between the most underdense and most overdense environments are also indicated for each subplot, with p-values available if > 0.05. Calculated for a 100 kpc radius aperture, in the following mass bins. 9 < log(M*) < 9.5 (upper left panel): KS test (SDSS) statistic: 0.432, KS test (GAMA) statistic: 0.263. 9.5 < log(M*) < 10 (upper right panel): KS test (SDSS) statistic: 0.601, KS test (GAMA) statistic: 0.378. 10 < log(M*) < 10.5 (lower left panel: KS test (SDSS) statistic: 0.757, KS test (GAMA) statistic: 0.053. 10.5 < log(M*) < 11 (lower right panel): KS test (SDSS) statistic: 0.064 p-value: 0.430, KS test (GAMA) statistic: 0.192.
Current usage metrics show cumulative count of Article Views (full-text article views including HTML views, PDF and ePub downloads, according to the available data) and Abstracts Views on Vision4Press platform.
Data correspond to usage on the plateform after 2015. The current usage metrics is available 48-96 hours after online publication and is updated daily on week days.
Initial download of the metrics may take a while.