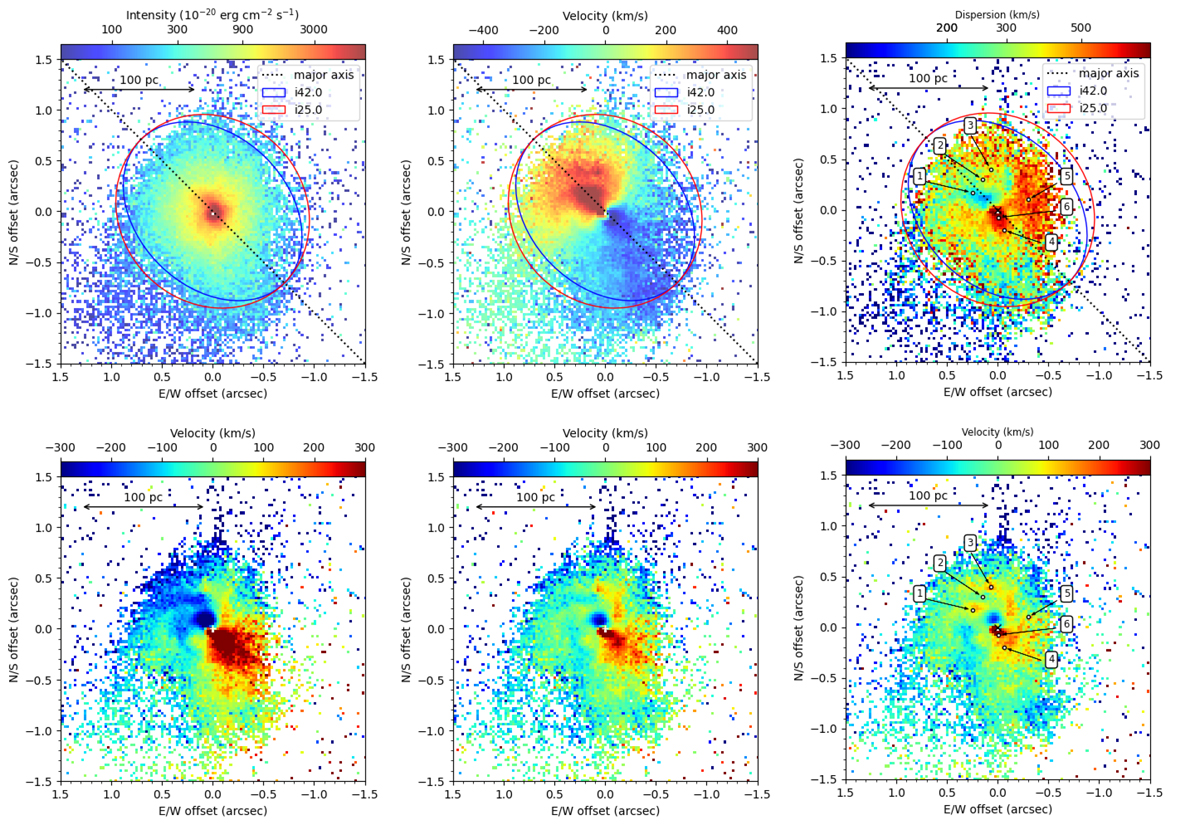
Fig. 9.
Download original image
Same as Fig. 4 but for the [O I] λ6300 line in the MUSE NFM cube. Only a subset of the NFM FOV, in which the S/N of the [O I] line is high enough, is shown. For illustration, the blue and red ellipses in the top panels show the expected morphology of a thin disk with an inclination of 42° and 25°, the inclination values favored by W13 and this work, respectively. In the rightmost panels, a cross marks the kinematic center; the apertures marked with black circles and labeled with numbers 1 to 6 are used in Fig. 10.
Current usage metrics show cumulative count of Article Views (full-text article views including HTML views, PDF and ePub downloads, according to the available data) and Abstracts Views on Vision4Press platform.
Data correspond to usage on the plateform after 2015. The current usage metrics is available 48-96 hours after online publication and is updated daily on week days.
Initial download of the metrics may take a while.