Fig. 7.
Download original image
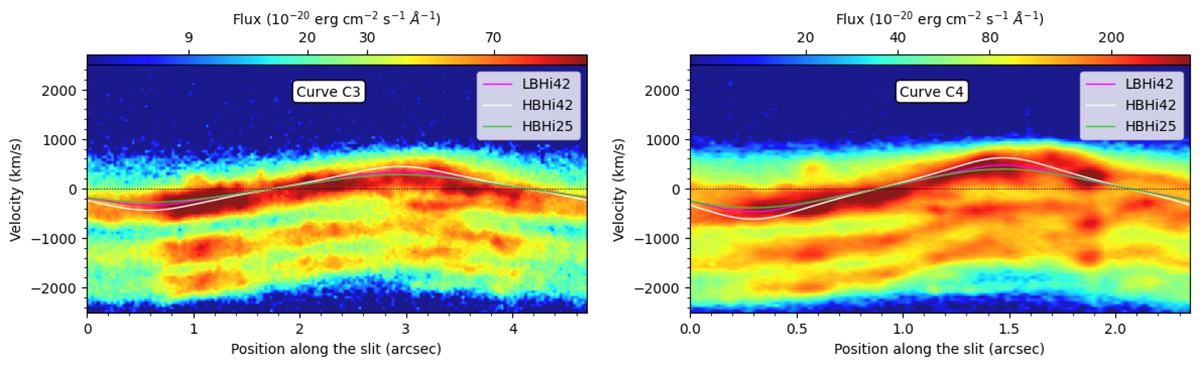
Extra pv diagrams of circular pseudo-slits in the [N II] λ6548 moment maps (Fig. 4) Left: same as Fig. 3 but for the pseudo-slit C3 (nuclear radius 0![]() 75), which is marked with a dotted magenta line in the left and central panels of Fig. 4. Right: same as the left panel but for a pseudo-slit at a nuclear radius of 0
75), which is marked with a dotted magenta line in the left and central panels of Fig. 4. Right: same as the left panel but for a pseudo-slit at a nuclear radius of 0![]() 375. The range of velocities is larger in order to show the full Hα+[N II] line complex.
375. The range of velocities is larger in order to show the full Hα+[N II] line complex.
Current usage metrics show cumulative count of Article Views (full-text article views including HTML views, PDF and ePub downloads, according to the available data) and Abstracts Views on Vision4Press platform.
Data correspond to usage on the plateform after 2015. The current usage metrics is available 48-96 hours after online publication and is updated daily on week days.
Initial download of the metrics may take a while.