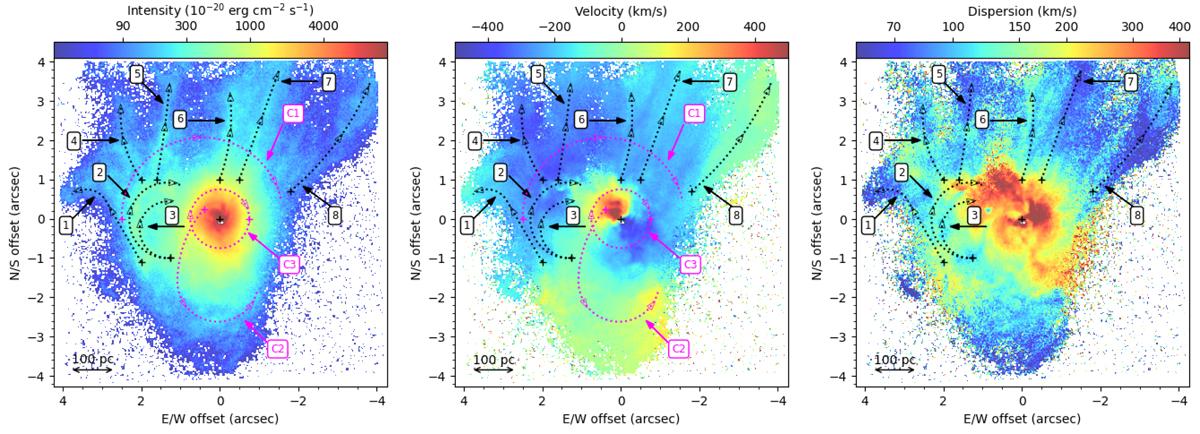
Fig. 4.
Download original image
[N II] λ6583 emission line moment maps from Gaussian fits to the NFM cube. From left to right are maps of the total intensity, velocity, and velocity dispersion. Eight ionized gas filaments (dotted black lines) and three pseudo-slits (dotted magenta lines) are numbered and indicated with arrows of the same color in all panels.
Current usage metrics show cumulative count of Article Views (full-text article views including HTML views, PDF and ePub downloads, according to the available data) and Abstracts Views on Vision4Press platform.
Data correspond to usage on the plateform after 2015. The current usage metrics is available 48-96 hours after online publication and is updated daily on week days.
Initial download of the metrics may take a while.