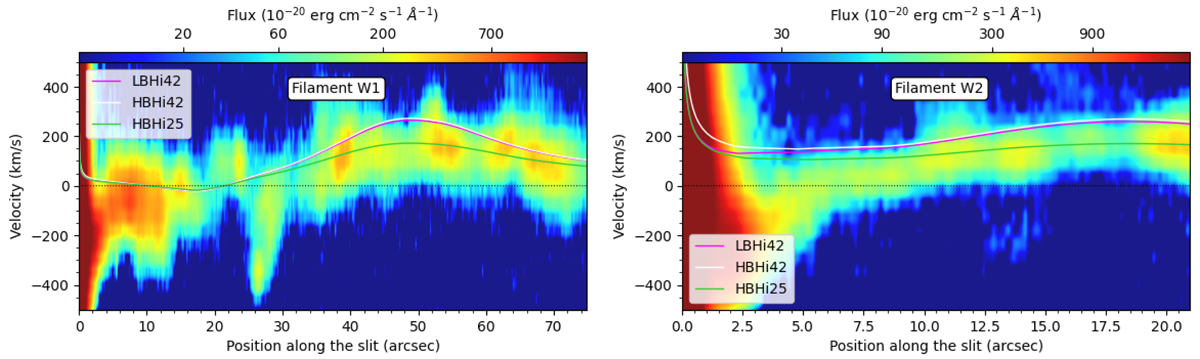
Fig. 3.
Download original image
Position-velocity diagrams of the [N II] λ6583 line for pseudo-slits along the gas filaments W1 and W2 identified in Fig. 2. The x-axis zero position of each filament corresponds to the black cross in Fig. 2. The three curves are the expected disk rotation velocities with the parameters described in Sect. 7.1 and Fig. 2, with colors as listed in the insert. At offsets beyond 10″, the velocities of both filaments are best fit with the i = 25° model. This figure is discussed in Sect. 7.1 but placed here for easy comparison with Fig. 2.
Current usage metrics show cumulative count of Article Views (full-text article views including HTML views, PDF and ePub downloads, according to the available data) and Abstracts Views on Vision4Press platform.
Data correspond to usage on the plateform after 2015. The current usage metrics is available 48-96 hours after online publication and is updated daily on week days.
Initial download of the metrics may take a while.