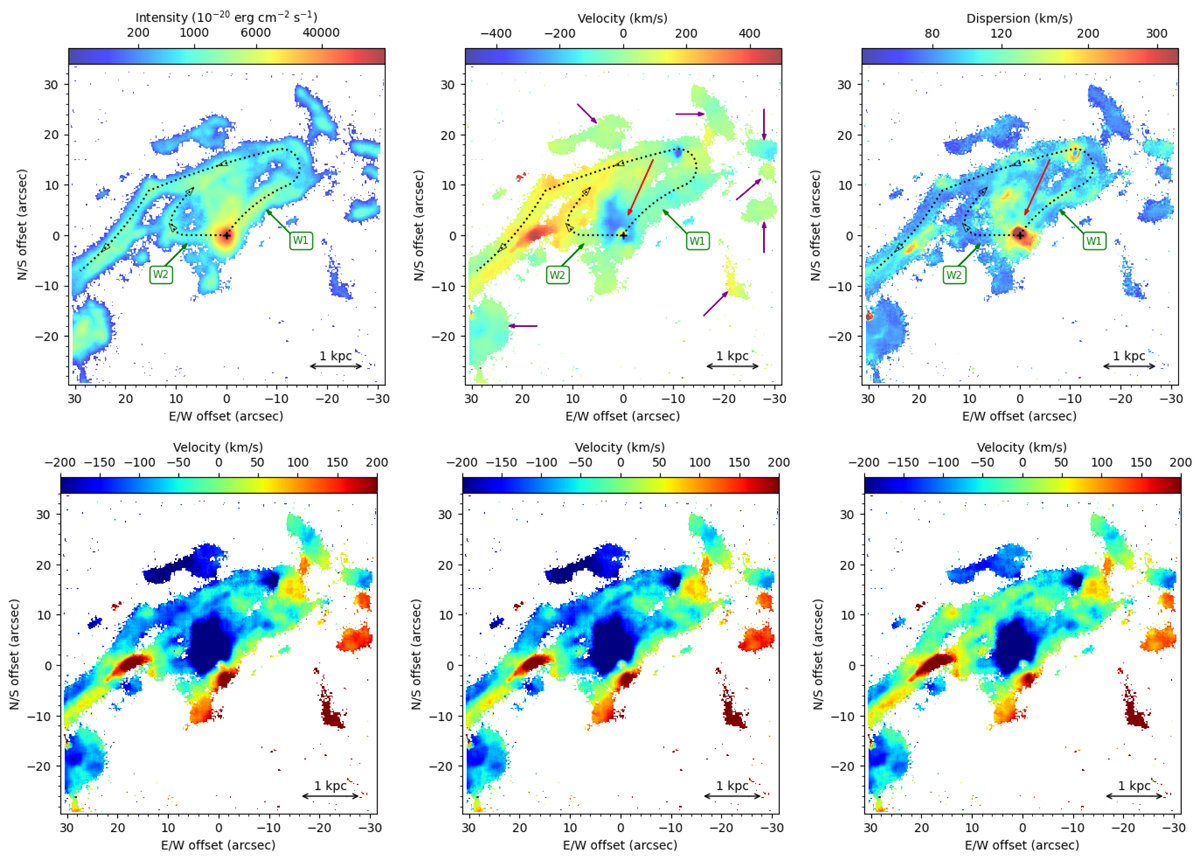
Fig. 2.
Download original image
Moment and residual maps for the [N II] λ6583 line from the MUSE WFM datacube. Top: moment maps of the [N II] λ6583 line as derived from Gaussian fits to the datacube. From left to right are the total intensity, velocity, and dispersion maps. Two ionized gas filaments (dotted black lines) are indicated by green arrows and the labels W1 and W2; these dotted lines are the pseudo-slits along which the pv diagrams of Fig. 3 are extracted. Several ionized gas bubbles are indicated by purple arrows, and the position of the outflow is indicated by a red arrow. Bottom: residual velocity maps of the [N II] λ6583 line in the datacube. These maps, discussed in Sect. 7.1, show the residual velocity field after subtracting a model of a rotating thin nuclear disk (in a SMBH plus stellar potential) for a black hole and nuclear disk with the following parameters (M•, disk inclination): 6.0 × 10⁹ M⊙ and 42° (left); 3.5 × 10⁹ M⊙ and 42° (middle); and 6.0 × 10⁹ M⊙ and 25° (right; our preferred model; see Sect. 7.1); all have a disk PA of 45°.
Current usage metrics show cumulative count of Article Views (full-text article views including HTML views, PDF and ePub downloads, according to the available data) and Abstracts Views on Vision4Press platform.
Data correspond to usage on the plateform after 2015. The current usage metrics is available 48-96 hours after online publication and is updated daily on week days.
Initial download of the metrics may take a while.