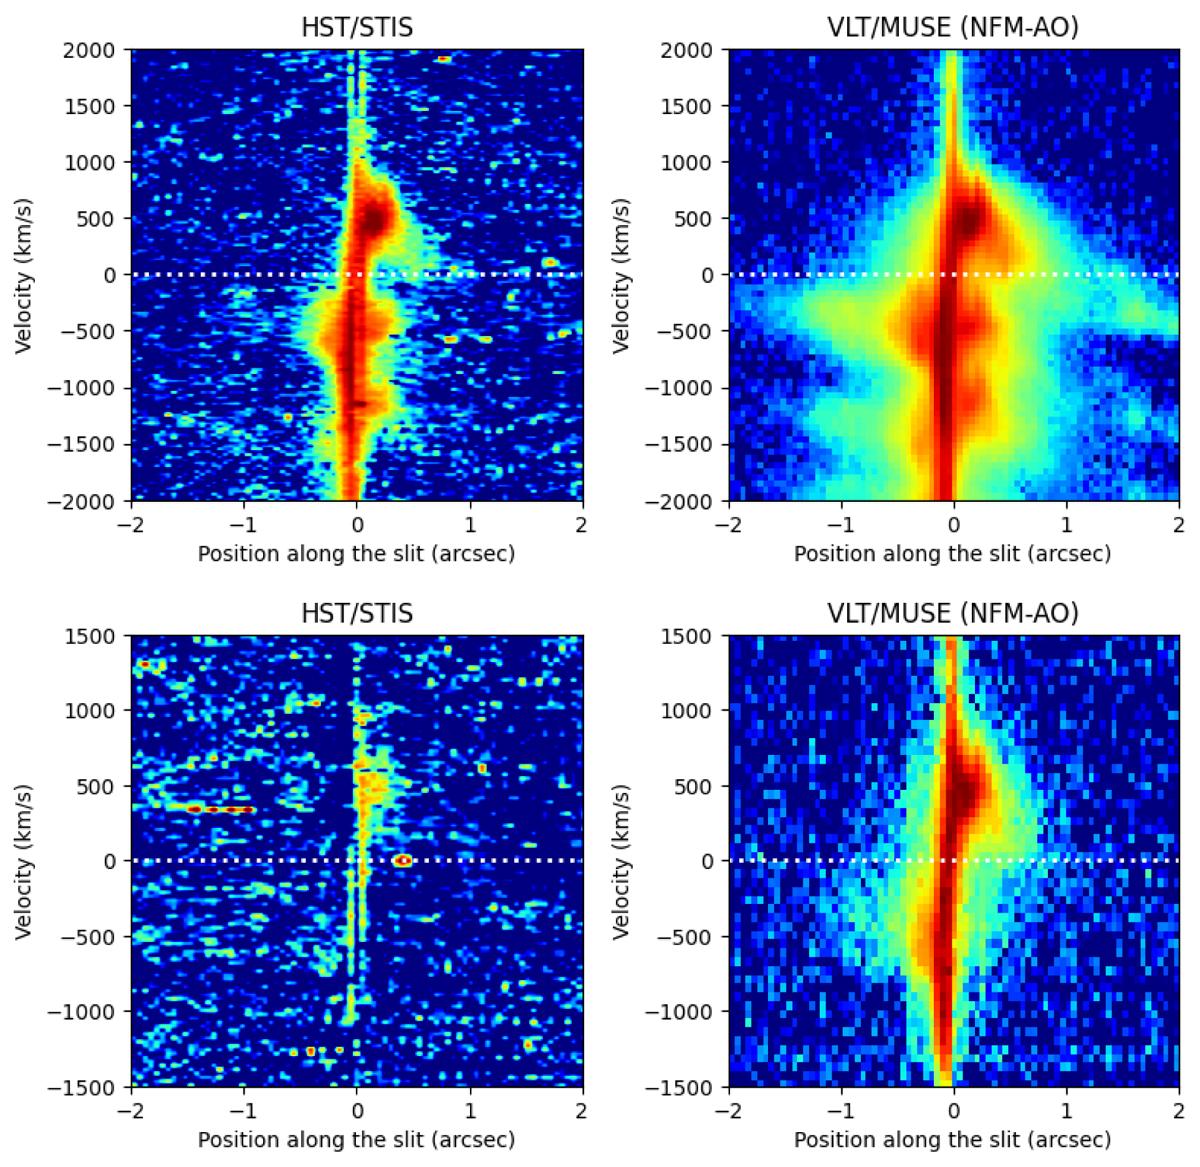
Fig. A.1.
Download original image
Comparison of the pv diagrams obtained from previous HST/STIS long-slit spectra and our VLT/MUSE-NFM-AO datacube for the [N II] λ6583 (top panels) and [O I] λ6300 (bottom panels) emission lines. The pv diagrams are along a slit through the nucleus of M87 at PA = 51°. The horizontal white lines correspond the recessional velocity of M87 adopted by W13: Vrecc = 1335 km s−1.
Current usage metrics show cumulative count of Article Views (full-text article views including HTML views, PDF and ePub downloads, according to the available data) and Abstracts Views on Vision4Press platform.
Data correspond to usage on the plateform after 2015. The current usage metrics is available 48-96 hours after online publication and is updated daily on week days.
Initial download of the metrics may take a while.