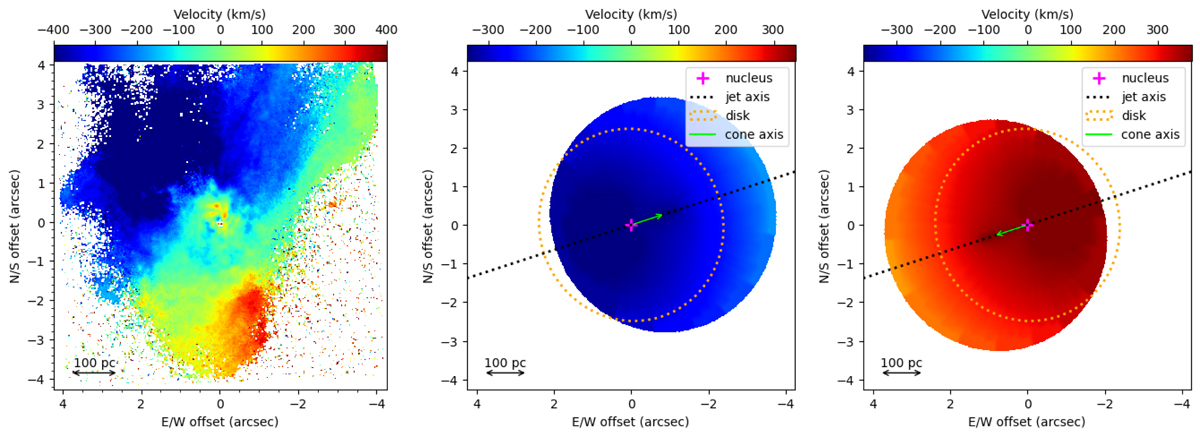
Fig. 17.
Download original image
Modeling of the ionized gas outflow in M 87. Left panel: residual (after subtracting the HBH i25 model for the nuclear disk) [N II] velocity map. We emphasize the gradients in the blue- and redshifted velocities to the northeast and south. Middle and right panels: models of a filled conical outflow made with KinMSpy, with each cone shown separately. The cone half-opening angles are 45° (approaching; middle panel) and 30° (receding; right panel). Each cone has an extent of 3″ along its axis, and the radial outflow velocity within each cone is 400 km s−1. The inclination of both cone axes to the LOS is 18°. The green line shows the projection of the cone axes on the plane of the sky; these project to PA 288°, the PA of the jet axis. The dotted orange lines delineate the projected shape of a disk perpendicular to the cone axes.
Current usage metrics show cumulative count of Article Views (full-text article views including HTML views, PDF and ePub downloads, according to the available data) and Abstracts Views on Vision4Press platform.
Data correspond to usage on the plateform after 2015. The current usage metrics is available 48-96 hours after online publication and is updated daily on week days.
Initial download of the metrics may take a while.