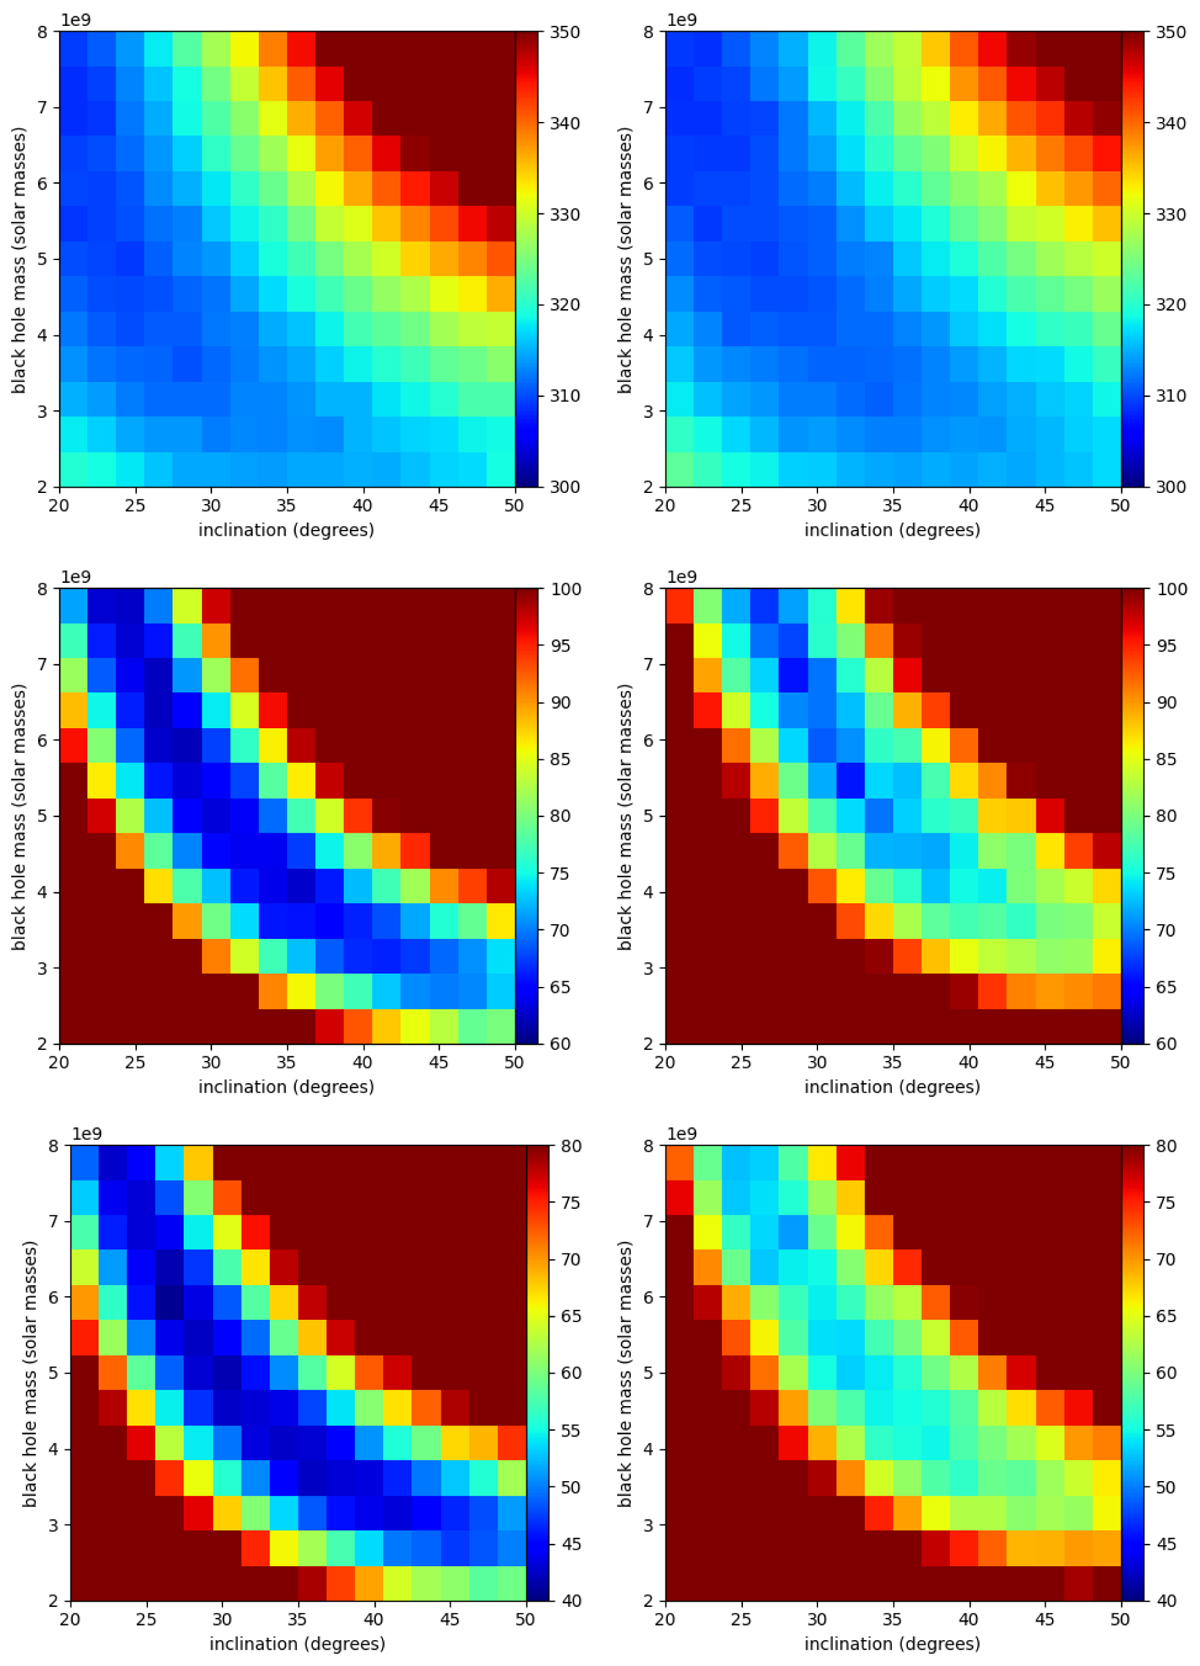
Fig. 15.
Download original image
Standard deviation (in km s−1) of values in the residual (observed minus KinMSpy model) velocity map, as a function of the black hole mass and disk inclination of the model, following the color bar to the right of each panel. The left column is for the Keplerian disk model, and the right column for the Jeter RIAF model. From top to bottom are the standard deviations measured using Gauss-fit, sigma-clip, and spiral-arm masks. The panels of each row follow the same color bar.
Current usage metrics show cumulative count of Article Views (full-text article views including HTML views, PDF and ePub downloads, according to the available data) and Abstracts Views on Vision4Press platform.
Data correspond to usage on the plateform after 2015. The current usage metrics is available 48-96 hours after online publication and is updated daily on week days.
Initial download of the metrics may take a while.