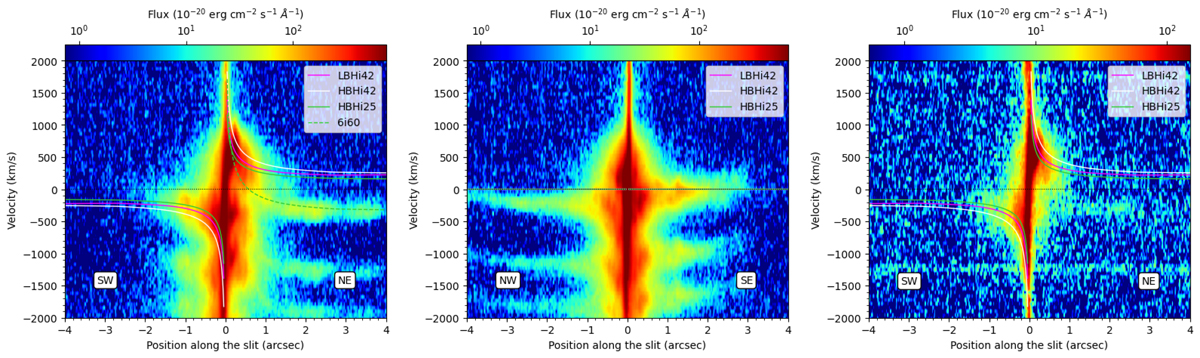
Fig. 13.
Download original image
Position-velocity diagrams of the Hα+[N II] λλ6548,6583 (left and central) and [O I] (right) emission lines in the NFM cube, along the W13 major (45°, left and right) and minor axes (135°, central). Rotation models overplotted follow the inset. The dotted green line is for an illustrative rotating model with M• = 6.0 × 10⁹ M⊙ (HBH), an inclination of 60°, and a constant blueshift of 650 km s−1 from the systemic velocity.
Current usage metrics show cumulative count of Article Views (full-text article views including HTML views, PDF and ePub downloads, according to the available data) and Abstracts Views on Vision4Press platform.
Data correspond to usage on the plateform after 2015. The current usage metrics is available 48-96 hours after online publication and is updated daily on week days.
Initial download of the metrics may take a while.