Fig. 11.
Download original image
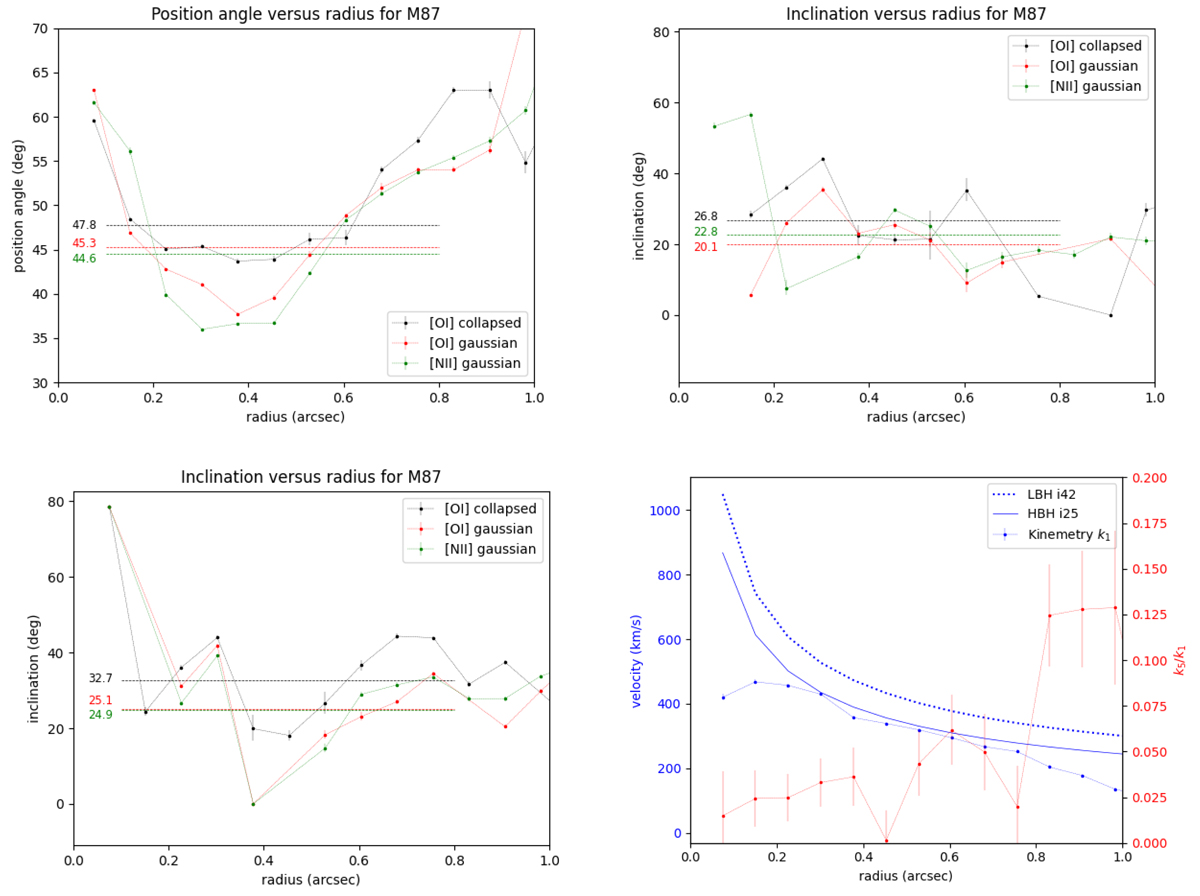
Results from Kinemetry for the subarcsecond ionized gas velocity maps. The top two panels show results when both disk PA and inclination are allowed to vary, while the bottom two panels show results when the PA is fixed at 45° and only inclination is allowed to vary. Specifically, the top panels show the variation in the best-fit PA (left) and inclination (right) with nuclear radius. The bottom-left panel shows the variation of the inclination when the PA is fixed to 45°. The velocity maps used were the single Gaussian fit velocity maps of [O I] (red) and Hα+[N II] (green) and the “collapsed” moment 1 map of the [O I] line (black). In each of these three panels, the horizontal lines in the corresponding color show the mean value over radii between between 0![]() 1 and 0
1 and 0![]() 8. The bottom-right panel shows the rotation curve (i.e., the “k1” parameter from Kinemetry; connected blue dots) derived by Kinemetry for the Gaussian-fit [O I] velocity map, and compares this to expectations of Keplerian rotation for the HBH i25 (solid blue line) and LBH i42 (dotted blue line) models, all following the left-hand y-axis. The red line, which follows the right-hand y-axis, shows the k5/k1 ratio (i.e., noncircular velocity to circular velocity ratio) derived by Kinemetry: low values here imply that disk velocities are dominated by rotation. At very small radii, too few pixels are included in each ring and Kinemetry results are unreliable.
8. The bottom-right panel shows the rotation curve (i.e., the “k1” parameter from Kinemetry; connected blue dots) derived by Kinemetry for the Gaussian-fit [O I] velocity map, and compares this to expectations of Keplerian rotation for the HBH i25 (solid blue line) and LBH i42 (dotted blue line) models, all following the left-hand y-axis. The red line, which follows the right-hand y-axis, shows the k5/k1 ratio (i.e., noncircular velocity to circular velocity ratio) derived by Kinemetry: low values here imply that disk velocities are dominated by rotation. At very small radii, too few pixels are included in each ring and Kinemetry results are unreliable.
Current usage metrics show cumulative count of Article Views (full-text article views including HTML views, PDF and ePub downloads, according to the available data) and Abstracts Views on Vision4Press platform.
Data correspond to usage on the plateform after 2015. The current usage metrics is available 48-96 hours after online publication and is updated daily on week days.
Initial download of the metrics may take a while.