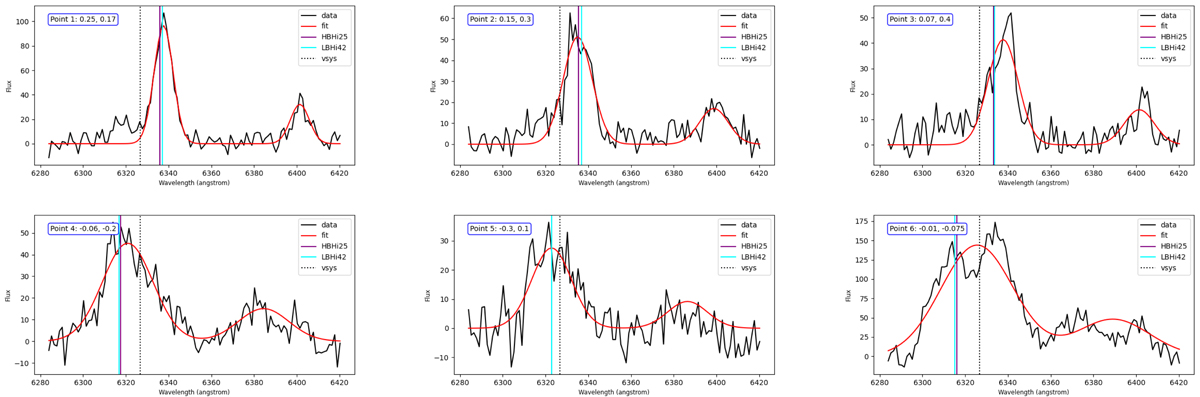
Fig. 10.
Download original image
[O I] spectral profiles (solid black lines) in selected apertures of the nuclear ionized disk for the apertures indicated in the right panels of Fig. 9, with their single Gaussian fit overlaid in red. The strong line is [O I] λ6300 and the redshifted weaker line is [O I] λ6364. The systemic velocity (dotted black line) and rotation velocities in models with M• = 6.0 × 10⁹ M⊙ and i = 25° (HBH i25; purple) and M• = 3.5 × 10⁹ M⊙ and i = 42° (LBH i42; cyan) are overplotted. Apertures are labeled by their number and their RA and Dec offset from the kinematic center in arcseconds. Apertures were selected to sample portions of the disk with different velocity dispersions and velocity residuals. Aperture 1 is located in the lowest dispersion area of the disk. Aperture 6 shows two components: one centered on the expectation of rotation and the other, with a potentially larger flux, is redshifted 950 km s−1 from the rotating component and 330 km s−1 from the systemic velocity. Apertures to the north (1, 2, and 3) show smaller dispersions, plus a potential component blueshifted by ∼350 km s−1 that is much weaker in flux than the rotating component.
Current usage metrics show cumulative count of Article Views (full-text article views including HTML views, PDF and ePub downloads, according to the available data) and Abstracts Views on Vision4Press platform.
Data correspond to usage on the plateform after 2015. The current usage metrics is available 48-96 hours after online publication and is updated daily on week days.
Initial download of the metrics may take a while.