Fig. 8.
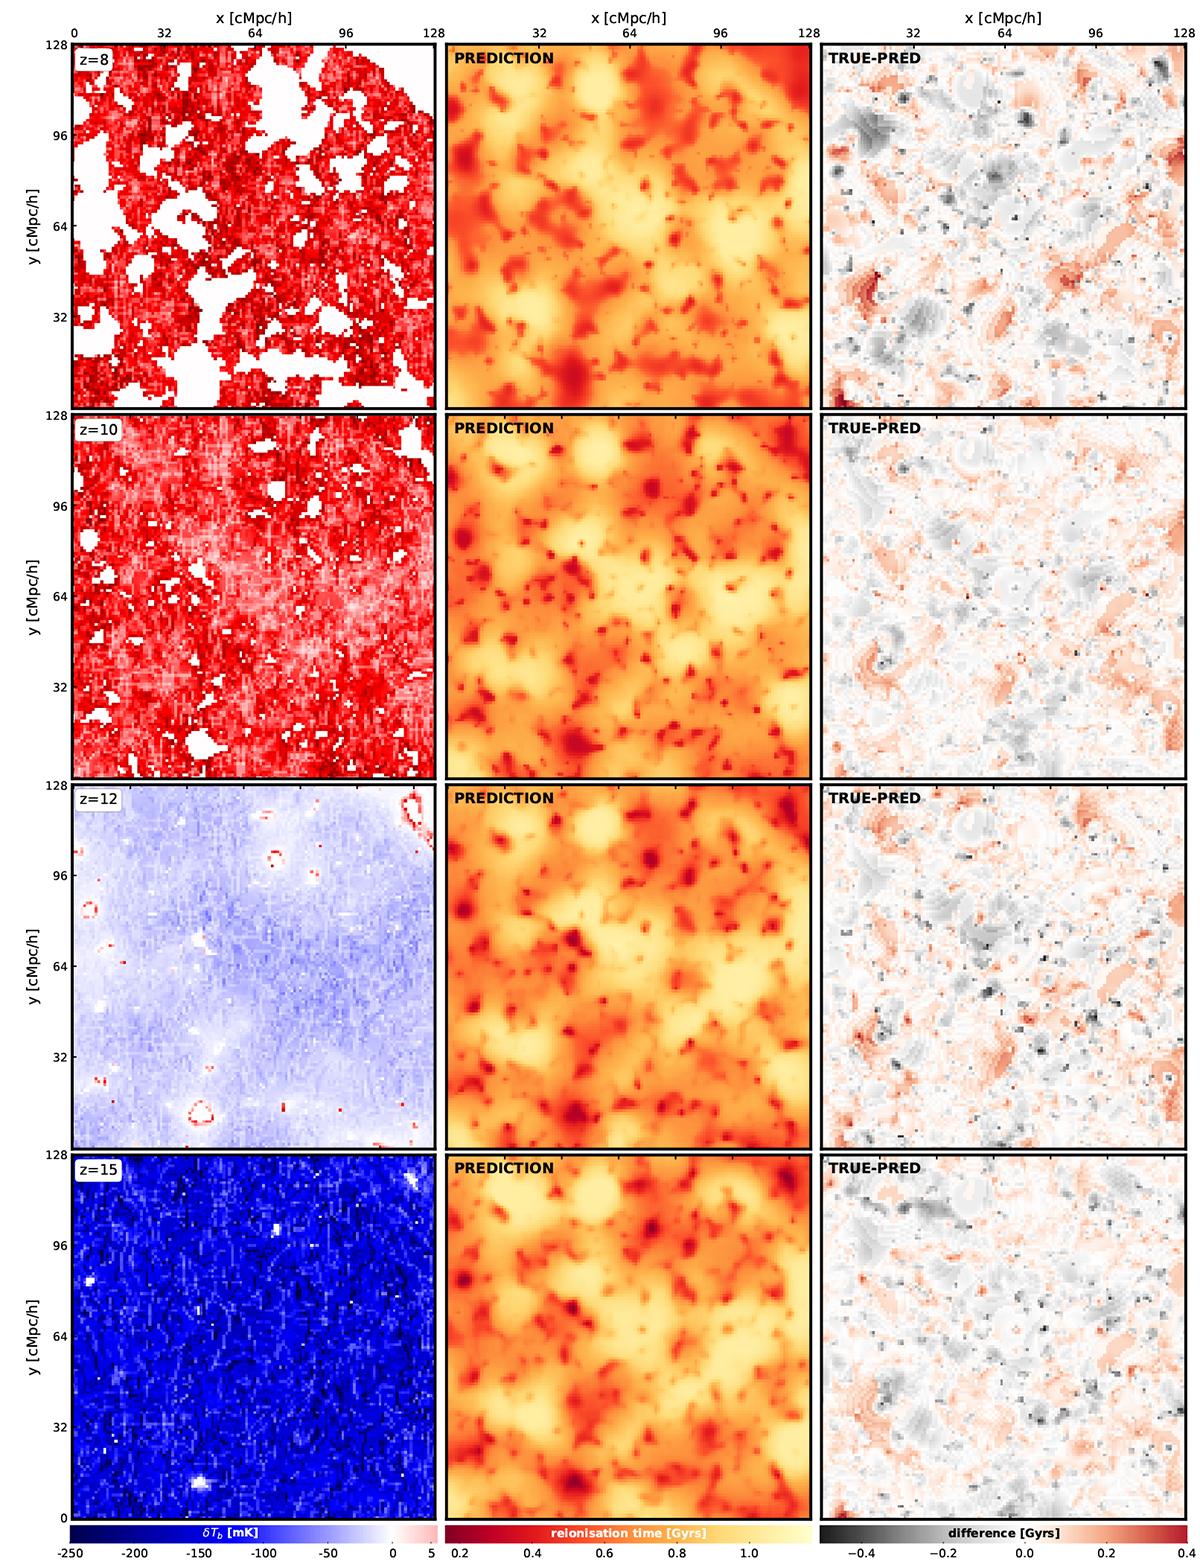
Download original image
Examples of prediction made by the CNN trained with maps at several redshifts zobs and ζ30. The left panels show the 21 cm δTb maps. The middle column shows the predicted treion fields. The right panels show the difference TRUE-PRED. Hence, the redder it appears on the map, the more the CNN overestimates the true value at the given pixel; instead, the darker it is, the more the CNN underestimates the real value. The true treion(r) is shown in Fig. 7.
Current usage metrics show cumulative count of Article Views (full-text article views including HTML views, PDF and ePub downloads, according to the available data) and Abstracts Views on Vision4Press platform.
Data correspond to usage on the plateform after 2015. The current usage metrics is available 48-96 hours after online publication and is updated daily on week days.
Initial download of the metrics may take a while.