Open Access
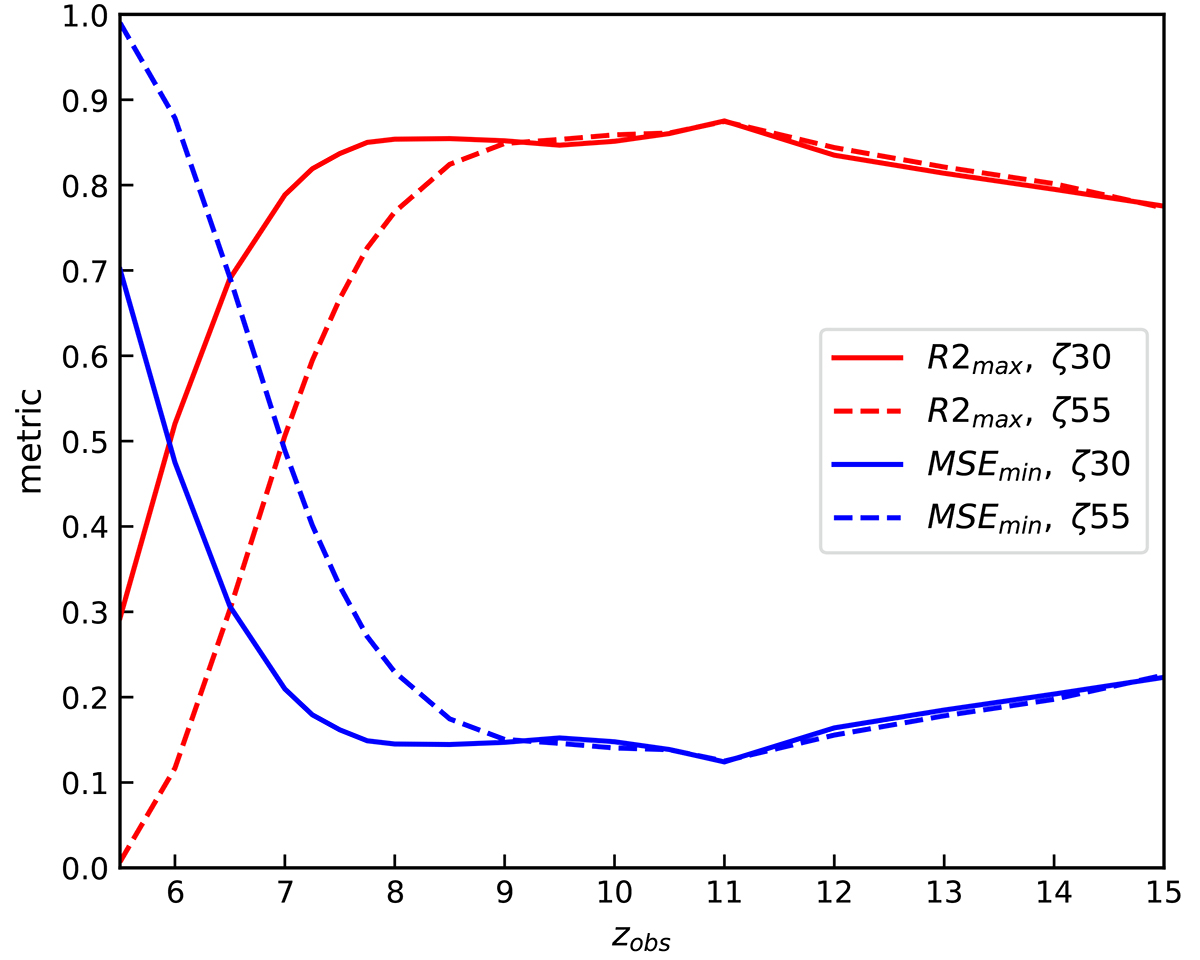
Fig. 6.
Download original image
Metric maximum and minimum with respect to the training redshift for the validation set. The red line is for the coefficient R2 and the blue line is for the MSE. The solid lines are for ζ55 and the dashed line for ζ30 model.
Current usage metrics show cumulative count of Article Views (full-text article views including HTML views, PDF and ePub downloads, according to the available data) and Abstracts Views on Vision4Press platform.
Data correspond to usage on the plateform after 2015. The current usage metrics is available 48-96 hours after online publication and is updated daily on week days.
Initial download of the metrics may take a while.