Open Access
Fig. 5.
Download original image
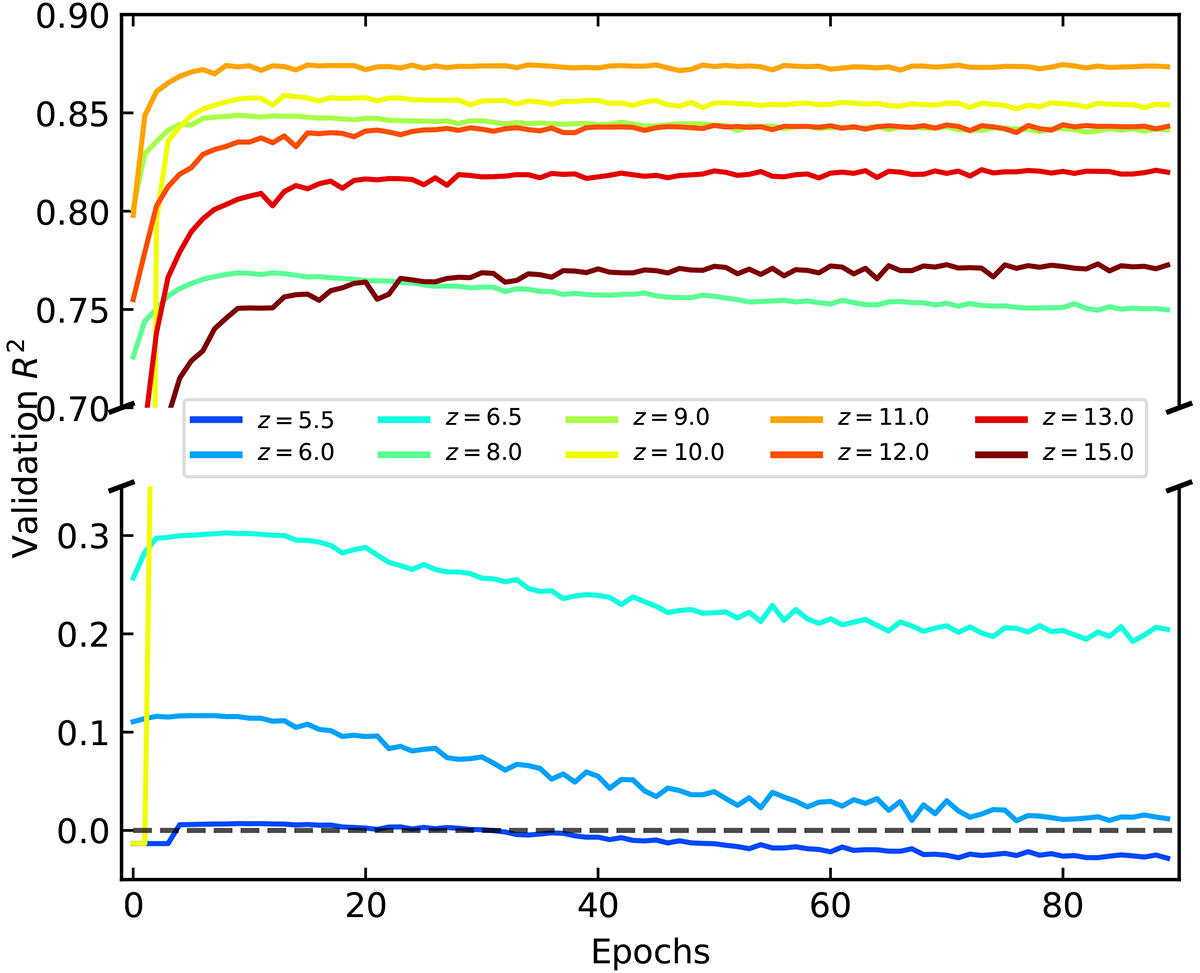
R2 coefficient with respect to epochs for a selection of training redshifts. These curves correspond to the validation phase and are for the ζ55 model. The curves for ζ30 are not shown here, but a comparison between the two models is shown in Fig. 6.
Current usage metrics show cumulative count of Article Views (full-text article views including HTML views, PDF and ePub downloads, according to the available data) and Abstracts Views on Vision4Press platform.
Data correspond to usage on the plateform after 2015. The current usage metrics is available 48-96 hours after online publication and is updated daily on week days.
Initial download of the metrics may take a while.