Fig. 4.
Download original image
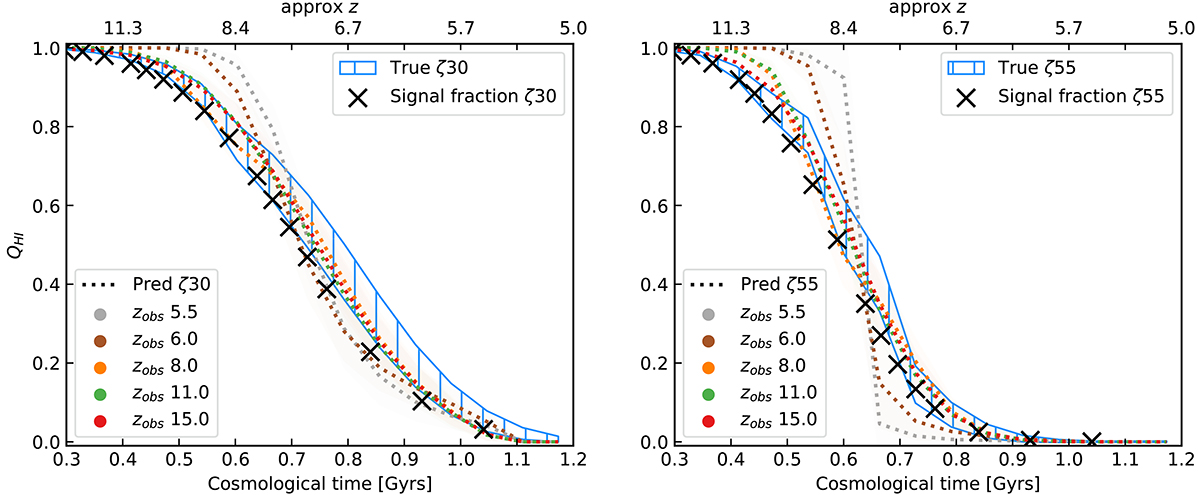
Neutral fraction of hydrogen with respect to time (bottom axis) and redshift (top axis) for ζ30 (left panel) and ζ55 (right panel). The crosses stand for the average non-zero signal fraction obtained from 21 cm images at different values of z (as if taken along the line of sight). The dashed areas stand for the true QHI computed from true maps of treion(r) (mean and std). The dotted lines stand for the average QHI obtained from maps of treion(r) predicted by the CNN.
Current usage metrics show cumulative count of Article Views (full-text article views including HTML views, PDF and ePub downloads, according to the available data) and Abstracts Views on Vision4Press platform.
Data correspond to usage on the plateform after 2015. The current usage metrics is available 48-96 hours after online publication and is updated daily on week days.
Initial download of the metrics may take a while.