Fig. B.2.
Download original image
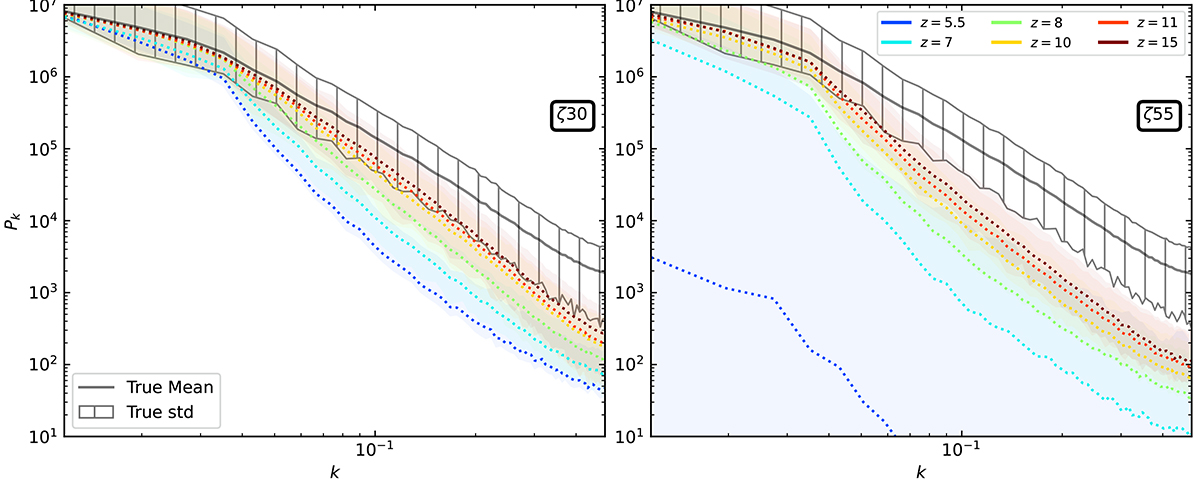
Power spectrum of the zreion(r) field obtained with the model ζ30 on the left and ζ55 on the right. k is the spatial frequency with dimension [cMpc−1h]. The black line stands for the ground truth and the dotted coloured lines depict predictions with different training redshifts. The shaded areas depict the dispersion around the median (1st and 99th percentiles) for both prediction and ground truth.
Current usage metrics show cumulative count of Article Views (full-text article views including HTML views, PDF and ePub downloads, according to the available data) and Abstracts Views on Vision4Press platform.
Data correspond to usage on the plateform after 2015. The current usage metrics is available 48-96 hours after online publication and is updated daily on week days.
Initial download of the metrics may take a while.