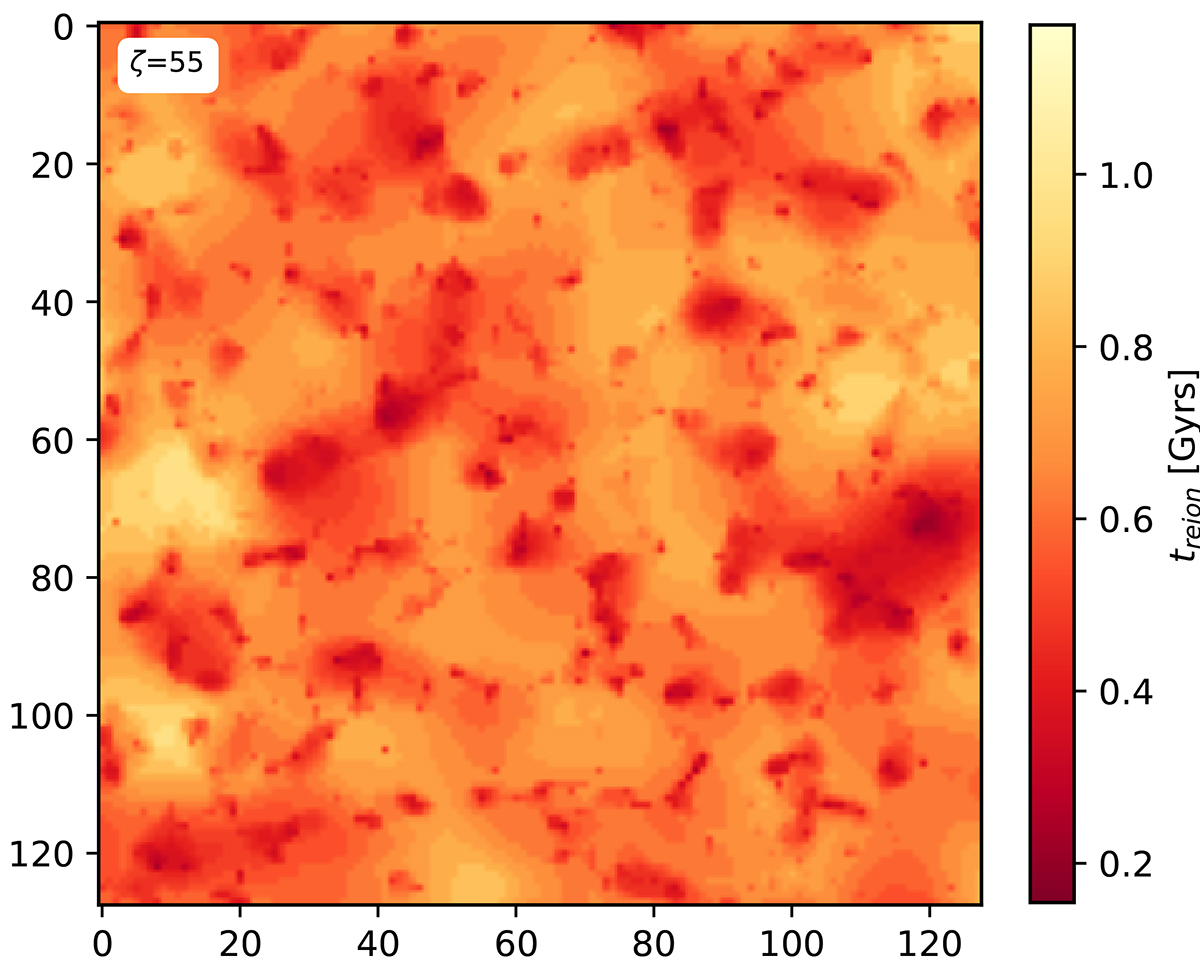
Fig. 2.
Download original image
Example of 2D treion(r) map from a ζ = 55 21cmFAST model. The darker the region, the sooner it reionised. In this scenario (and for the whole ζ55 dataset), the time of reionisation of the first HII regions is approximately 0.15 Gyr (z ≈ 20, darkest spots), and the last HI regions are reionised at around 1.1 Gyr (z ≈ 5.5, brightest regions). The mean value is 0.61 Gyr (z ≈ 8.4). This treion(r) map is associated with Fig. 1, taken at the same depth in the simulation box.
Current usage metrics show cumulative count of Article Views (full-text article views including HTML views, PDF and ePub downloads, according to the available data) and Abstracts Views on Vision4Press platform.
Data correspond to usage on the plateform after 2015. The current usage metrics is available 48-96 hours after online publication and is updated daily on week days.
Initial download of the metrics may take a while.