Open Access
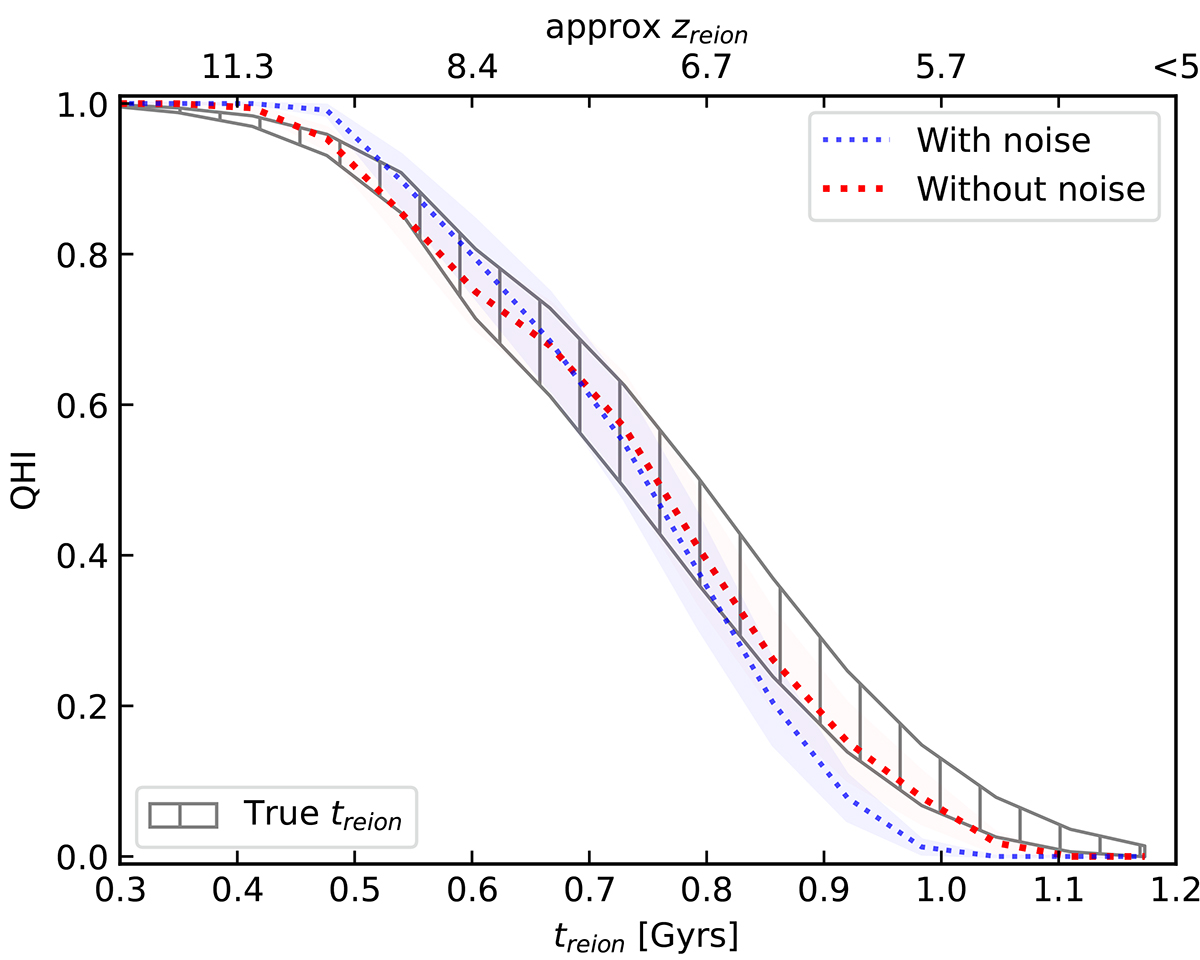
Fig. 18.
Download original image
QHI obtained from predictions at zobs = 8 with the model ζ30, including instrumental effects for a typical SKA observation. Hatched area stands for the true field QHI. Dotted lines and shaded area depict the mean and standard deviation of CNN predictions QHI with (blue) and without (red) instrumental effects.
Current usage metrics show cumulative count of Article Views (full-text article views including HTML views, PDF and ePub downloads, according to the available data) and Abstracts Views on Vision4Press platform.
Data correspond to usage on the plateform after 2015. The current usage metrics is available 48-96 hours after online publication and is updated daily on week days.
Initial download of the metrics may take a while.