Fig. 17.
Download original image
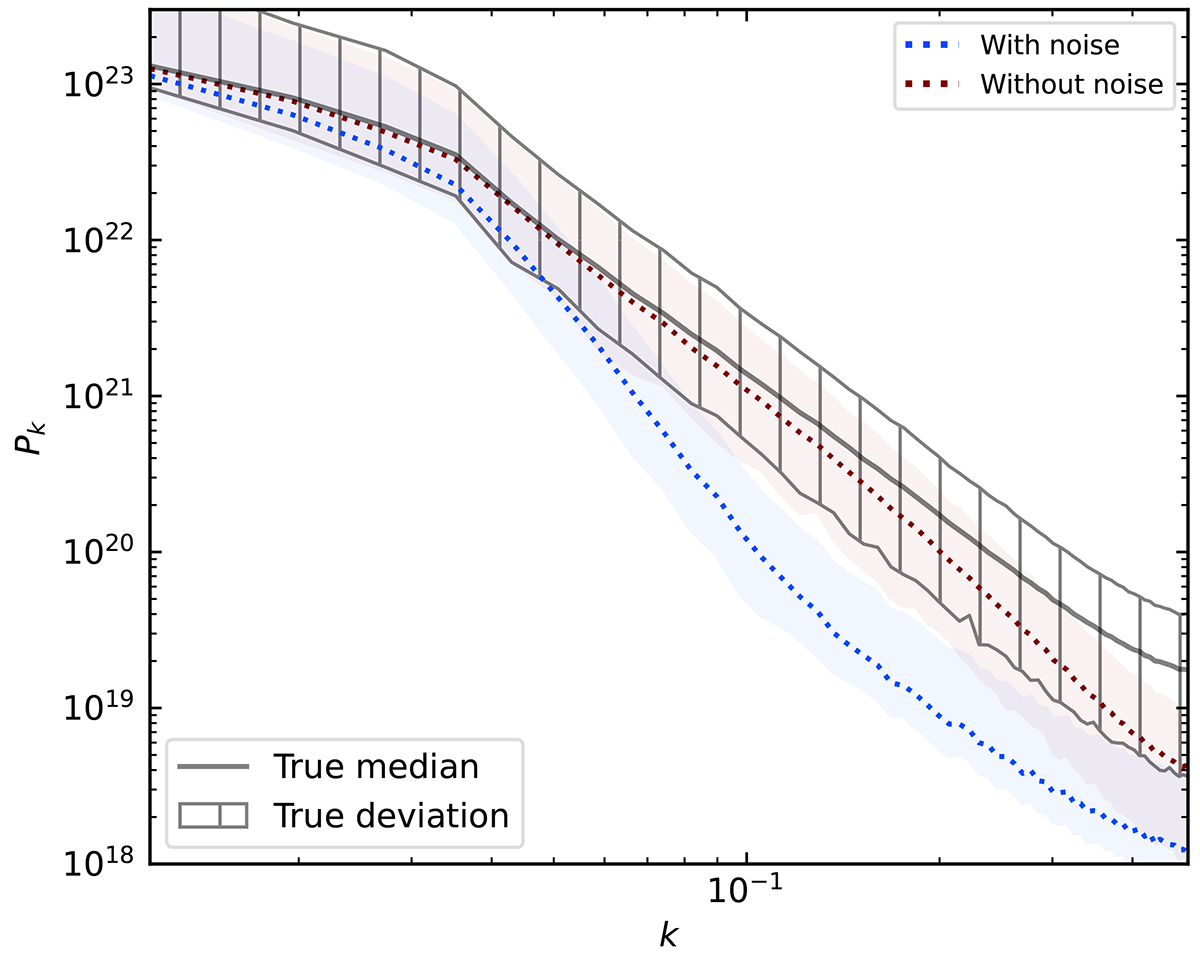
Power spectrum of the treion(r) field obtained with the model ζ30 at zobs = 8, including instrumental effects for a typical SKA observation. The black line and hatched area stand for the mean and standard deviation of the true field P(k). The dotted lines and shaded area depict the median and dispersion (1st and 99th percentiles) of CNN predictions P(k) with (blue) and without (red) instrumental effects.
Current usage metrics show cumulative count of Article Views (full-text article views including HTML views, PDF and ePub downloads, according to the available data) and Abstracts Views on Vision4Press platform.
Data correspond to usage on the plateform after 2015. The current usage metrics is available 48-96 hours after online publication and is updated daily on week days.
Initial download of the metrics may take a while.