Open Access
Fig. 15.
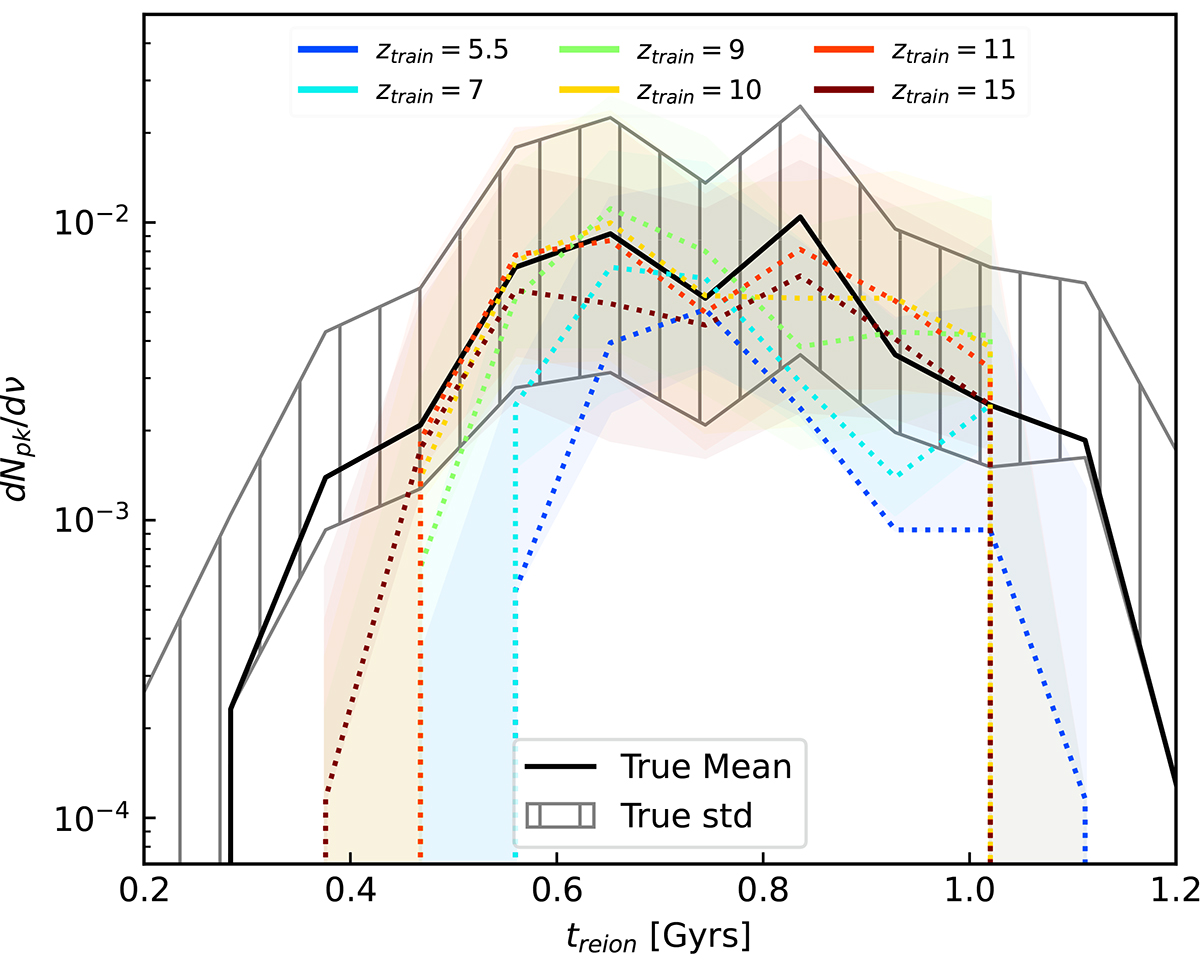
Download original image
Distribution of reionisation times for treion(r) minima. The solid line is obtained from true treion(r), while the dotted lines are obtained from predictions at several zobs. The shaded areas show the dispersion around the median (mean and std) for both predictions and ground truth.
Current usage metrics show cumulative count of Article Views (full-text article views including HTML views, PDF and ePub downloads, according to the available data) and Abstracts Views on Vision4Press platform.
Data correspond to usage on the plateform after 2015. The current usage metrics is available 48-96 hours after online publication and is updated daily on week days.
Initial download of the metrics may take a while.