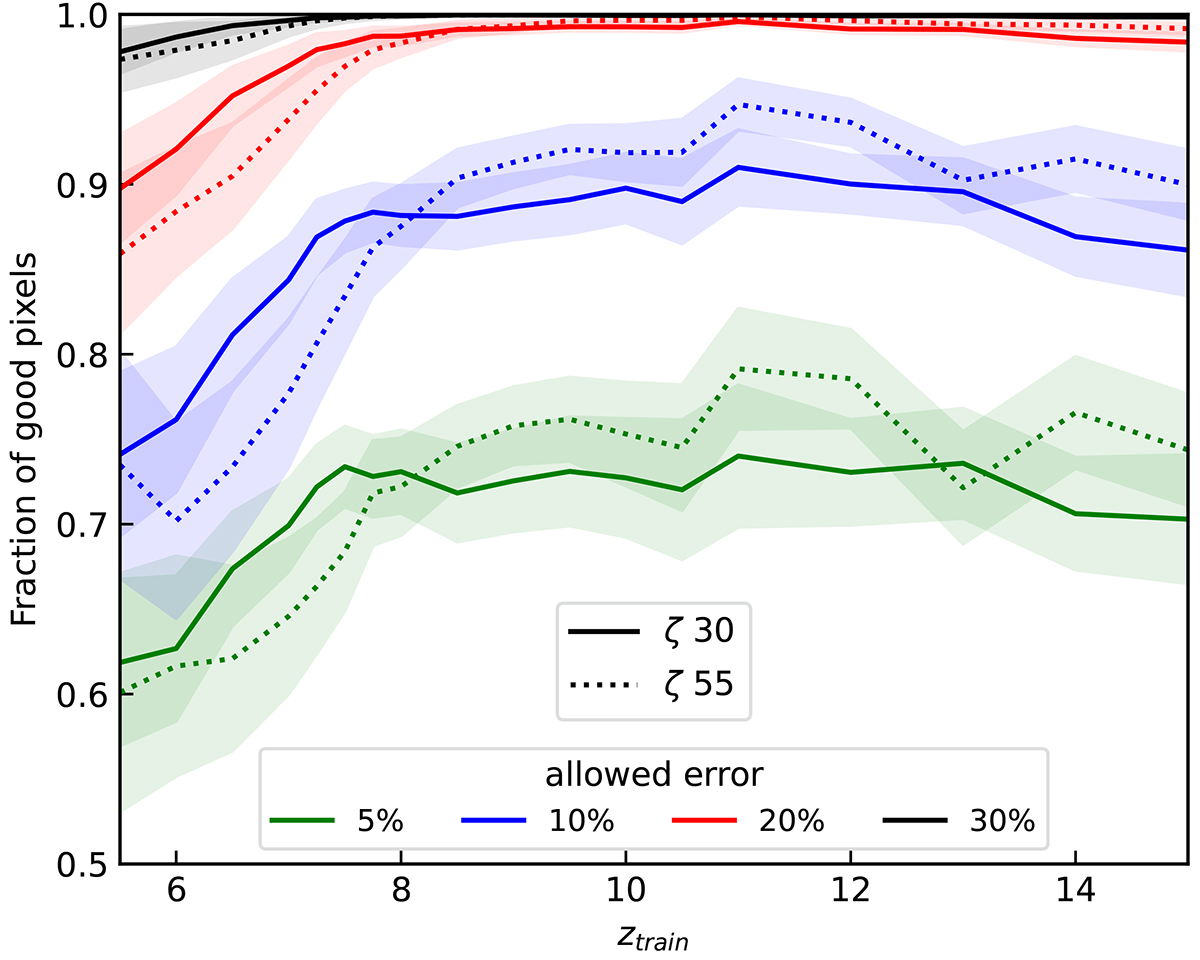
Fig. 11.
Download original image
Fitting fraction with respect to redshift. The greater the allowed error for a pixel (between prediction and ground truth) is, the larger the number of pixels that have a value close to the true one within this error (i.e. ‘good pixels’). The solid lines are for ζ55 and the dotted lines for ζ30. The shaded areas depict the standard deviation around the mean for the whole predicted dataset.
Current usage metrics show cumulative count of Article Views (full-text article views including HTML views, PDF and ePub downloads, according to the available data) and Abstracts Views on Vision4Press platform.
Data correspond to usage on the plateform after 2015. The current usage metrics is available 48-96 hours after online publication and is updated daily on week days.
Initial download of the metrics may take a while.