Fig. 10.
Download original image
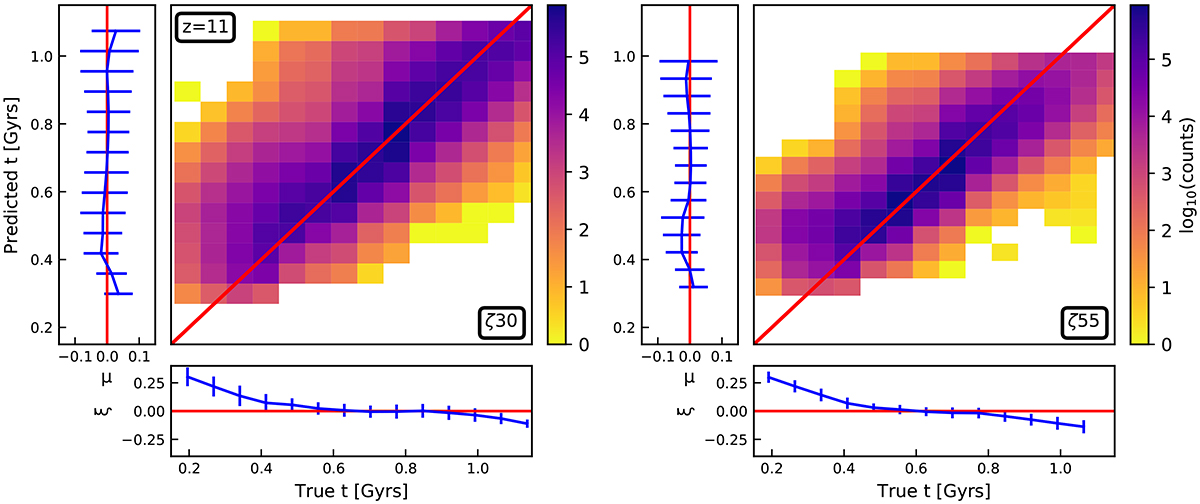
True vs predicted maps obtained from the full dataset in the test set, for zobs = 11 and for both models. The red lines stand for the perfect correlation. The bottom and left histograms are the mean and the standard deviation of the residual r: r = Predicted−True, in both vertical and horizontal directions. The bottom histogram stands for the learning error, while the side histogram stands for the recovery uncertainty. In practice, the recovery uncertainty is the only accessible estimator since the ground truth will not be accessible.
Current usage metrics show cumulative count of Article Views (full-text article views including HTML views, PDF and ePub downloads, according to the available data) and Abstracts Views on Vision4Press platform.
Data correspond to usage on the plateform after 2015. The current usage metrics is available 48-96 hours after online publication and is updated daily on week days.
Initial download of the metrics may take a while.