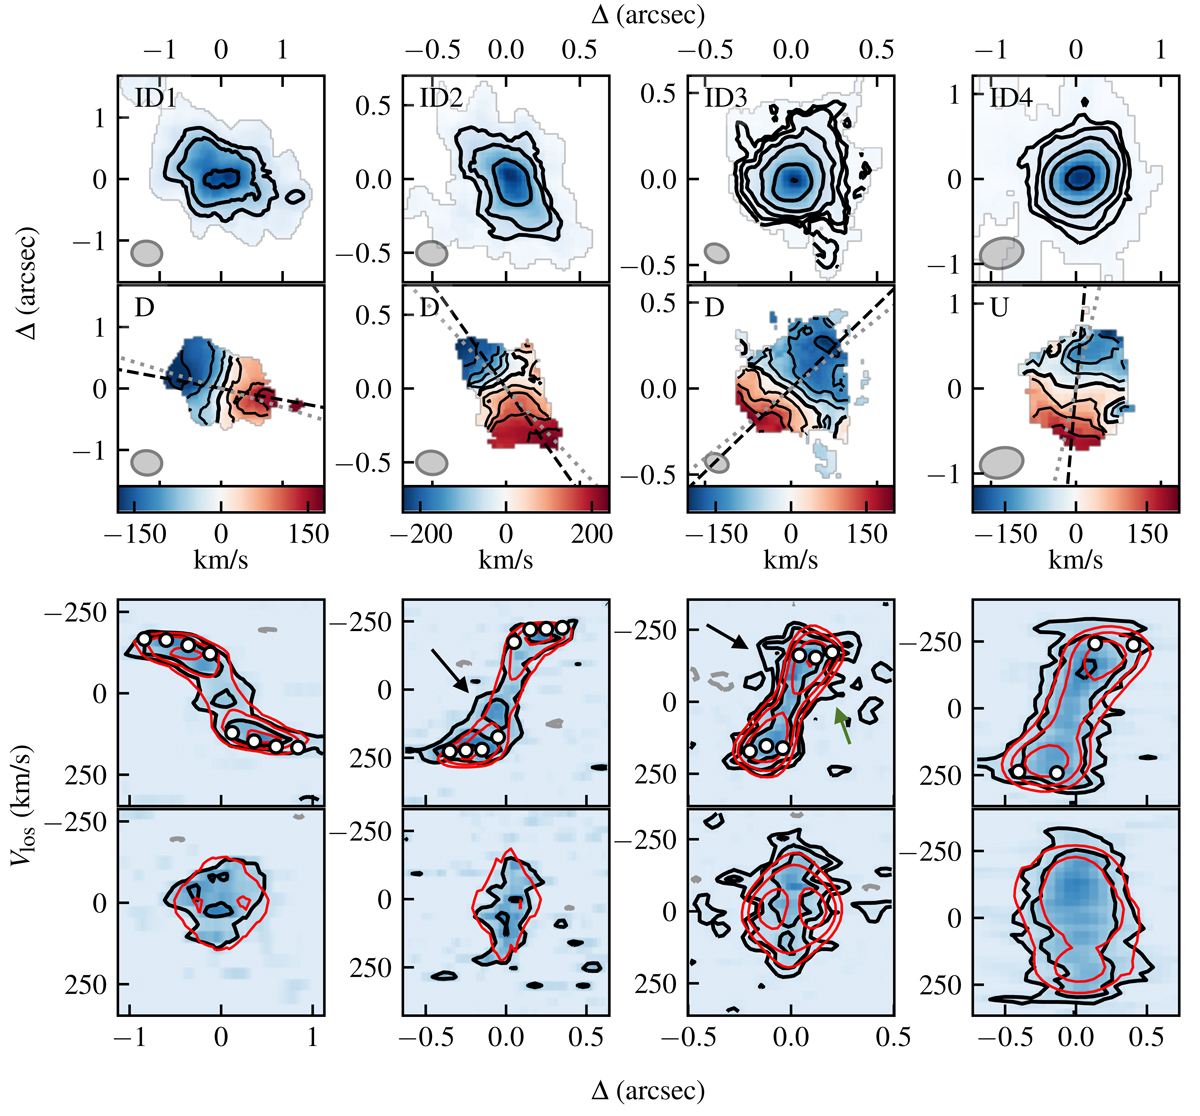
Fig. 7.
Download original image
For each target with ID in the upper left, we show from top to bottom: the total-flux map and the velocity field and the major and minor-axis PVDs. In the total-flux maps, the first external contour is a “pseudo-contour” (see Appendix B in Roman-Oliveira et al. 2023 for details) at 4 RMS. In the velocity field, the black lines show the iso-velocity contours, with the thickest one indicating the systemic velocity. The black dashed and gray dotted lines are the kinematic and morphological position angles, respectively. For the morphological position angle, we show the one obtained from fitting HST data when available and the total-flux map otherwise. The beam is shown in the bottom left. In the PVDs, the y-axis shows the line-of-sight velocities centered on the systemic velocity or redshift and the x-axis shows the distance with respect to the center of the kinematic model. The contours for the data (solid black) and the model (red) are at [1, 2, 4, 8, 16, 32] × 2.5 RMS. The gray dotted contours are at −2.5 RMS. The white circles are the best-fit line-of-sight rotation velocities. For each target, we indicate in the velocity field whether it is classified as a disk (D), merger (M) or uncertain (U). The arrows show kinematic anomalies that are described and discussed in detail in Sect. 6.
Current usage metrics show cumulative count of Article Views (full-text article views including HTML views, PDF and ePub downloads, according to the available data) and Abstracts Views on Vision4Press platform.
Data correspond to usage on the plateform after 2015. The current usage metrics is available 48-96 hours after online publication and is updated daily on week days.
Initial download of the metrics may take a while.