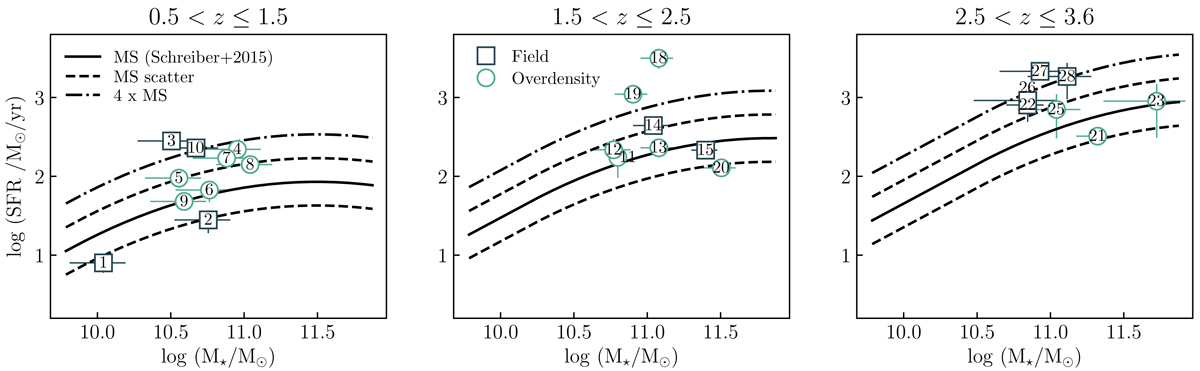
Fig. 3.
Download original image
Distribution of the ALPAKA galaxies in the stellar mass (M⋆) – SFR plane, divided in three redshift bins. The dark green squares show ALPAKA galaxies in the field, while the green circles show galaxies in overdense regions (e.g., clusters, protoclusters, groups). The solid line in the three panels show the empirical main-sequence relations from Schreiber et al. (2015) at z = 1.3, 2.2, 3, which are the average redshifts of ALPAKA targets in the three bins. The dashed and dot-dashed lines show the ±1σ scatter and the line dividing the main-sequence and starburst galaxies, respectively (Rodighiero et al. 2011). We note that only the 25 ALPAKA targets with good estimates of both M⋆ and SFR are shown.
Current usage metrics show cumulative count of Article Views (full-text article views including HTML views, PDF and ePub downloads, according to the available data) and Abstracts Views on Vision4Press platform.
Data correspond to usage on the plateform after 2015. The current usage metrics is available 48-96 hours after online publication and is updated daily on week days.
Initial download of the metrics may take a while.