Fig. 2.
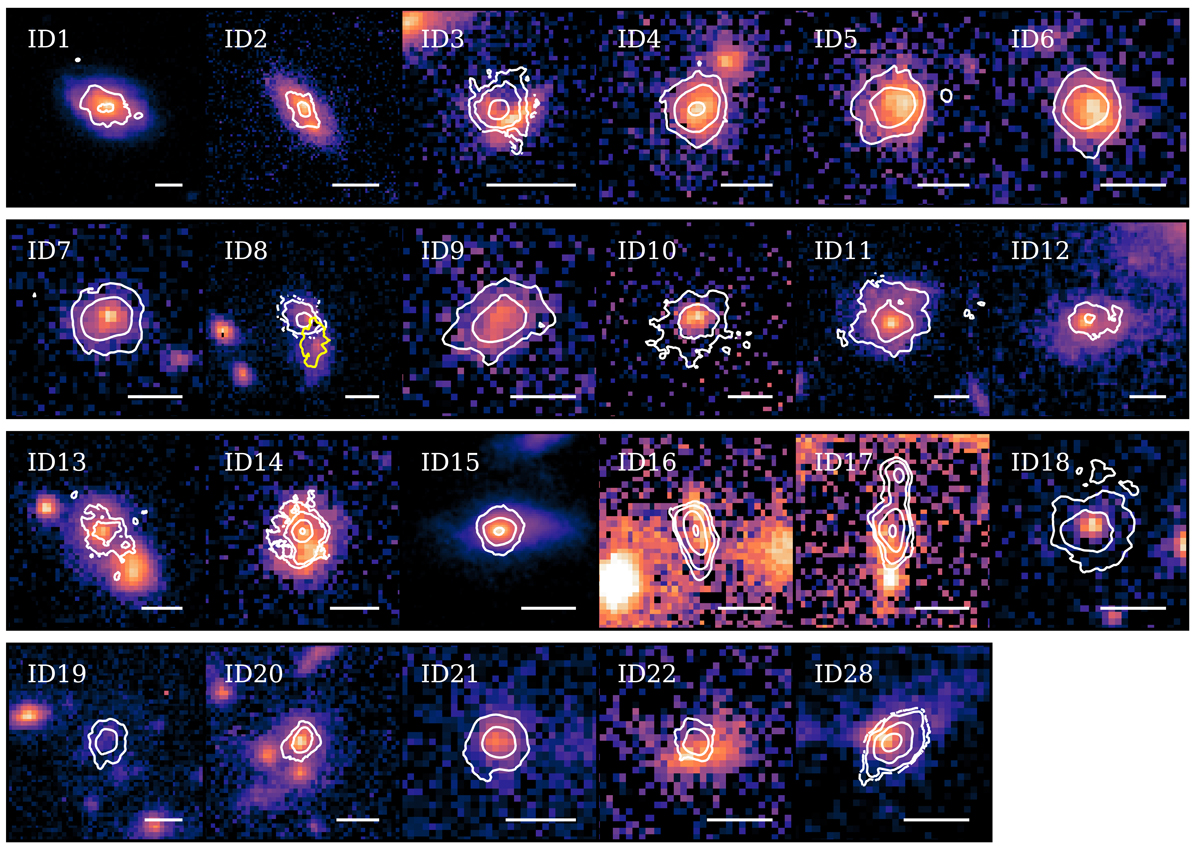
Download original image
HST images with contours of the CO or [CI] total-flux maps from ALMA for the 23 ALPAKA galaxies with HST observations. The lowest white contour is a “pseudo-contour” – see Appendix B in Roman-Oliveira et al. (2023) for details – at 4 RMS. The additional yellow contour in the ID8 panel shows a second source detected in CO(2–1) (see Sect. 6.4 for details). The CO transitions and HST filters shown here are listed in Tables 2 and 3, respectively. The white bar in the bottom left of each panel shows a scale of 1″.
Current usage metrics show cumulative count of Article Views (full-text article views including HTML views, PDF and ePub downloads, according to the available data) and Abstracts Views on Vision4Press platform.
Data correspond to usage on the plateform after 2015. The current usage metrics is available 48-96 hours after online publication and is updated daily on week days.
Initial download of the metrics may take a while.