Fig. C.1.
Download original image
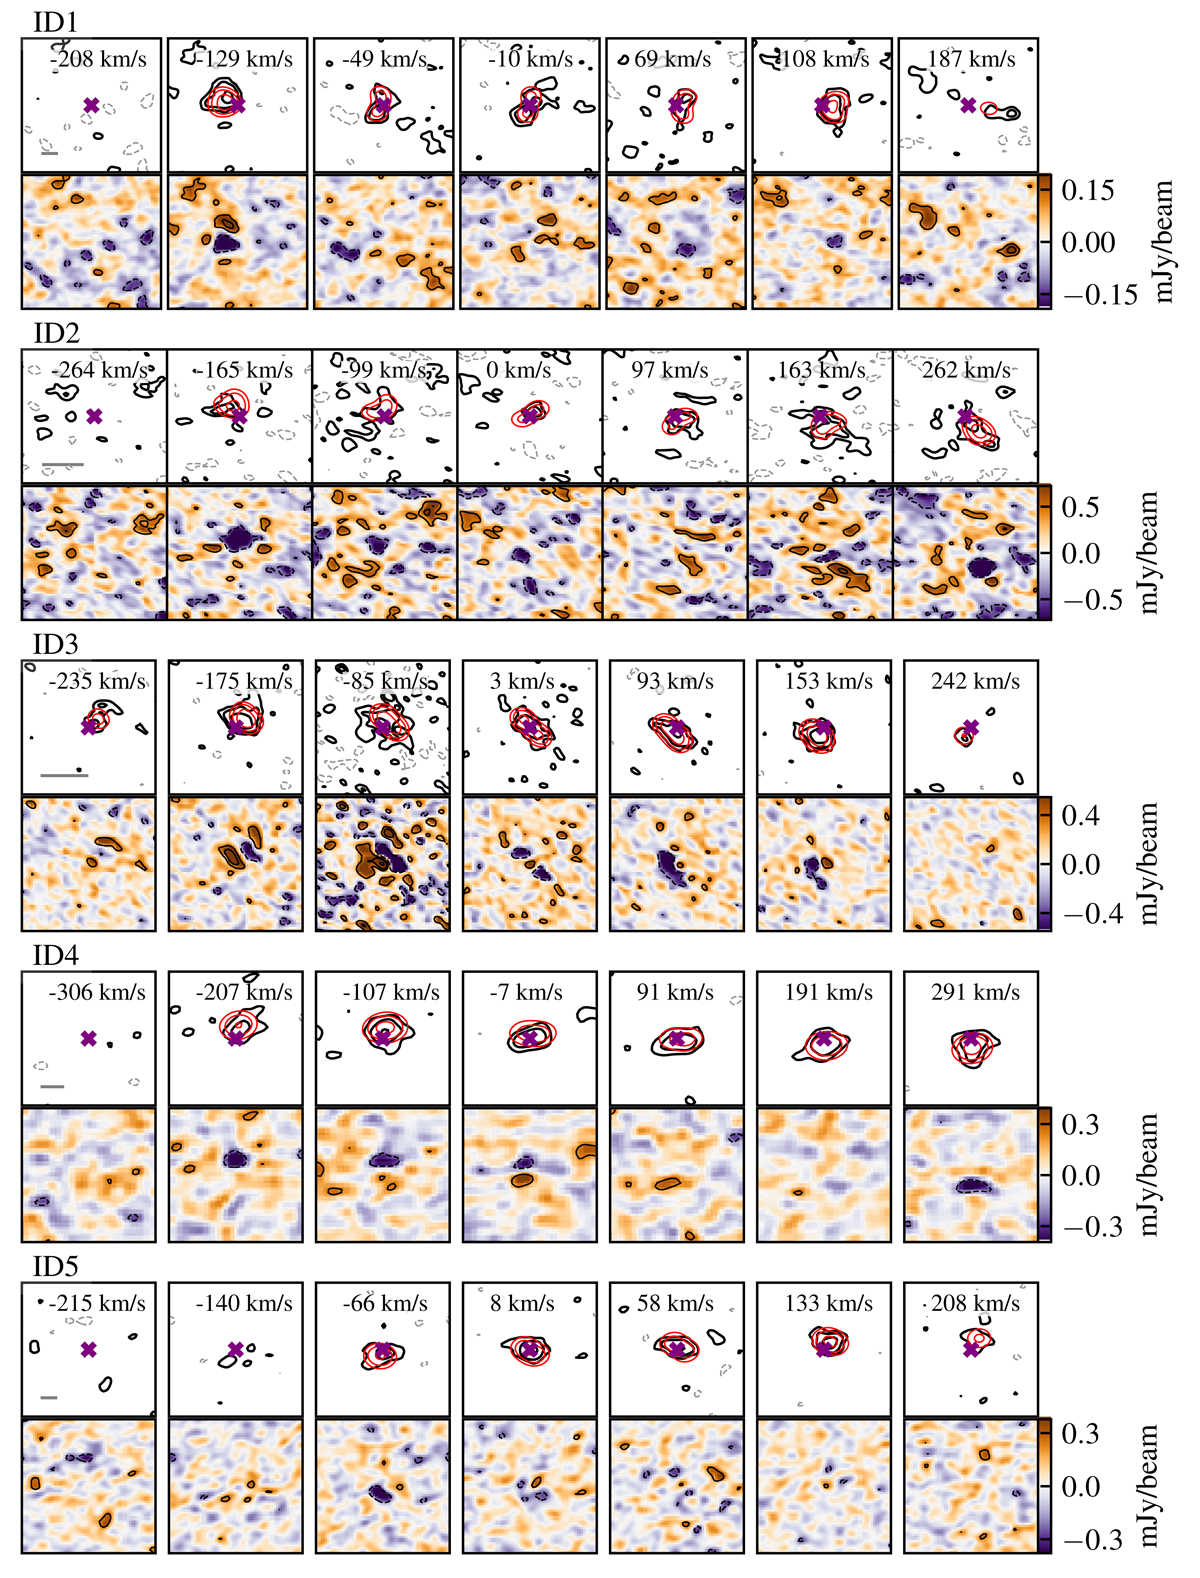
For each ALPAKA target, we show 7 representative channel maps for the data (black contours) and the rotating disk model (red contours) in the upper panels and the residuals in the bottom panels. The solid contours of the data and the models are at [1, 2, 4, 8, 16, 32] × 2.5 RMS, while the dashed gray contours are at -2.5 RMS. The purple cross shows the location of the center of the disk model. For the residuals, we show the emission over a scale of ±5 RMS. The gray bar in the first channel of each target (bottom left) shows a scale of 0.5″.
Current usage metrics show cumulative count of Article Views (full-text article views including HTML views, PDF and ePub downloads, according to the available data) and Abstracts Views on Vision4Press platform.
Data correspond to usage on the plateform after 2015. The current usage metrics is available 48-96 hours after online publication and is updated daily on week days.
Initial download of the metrics may take a while.