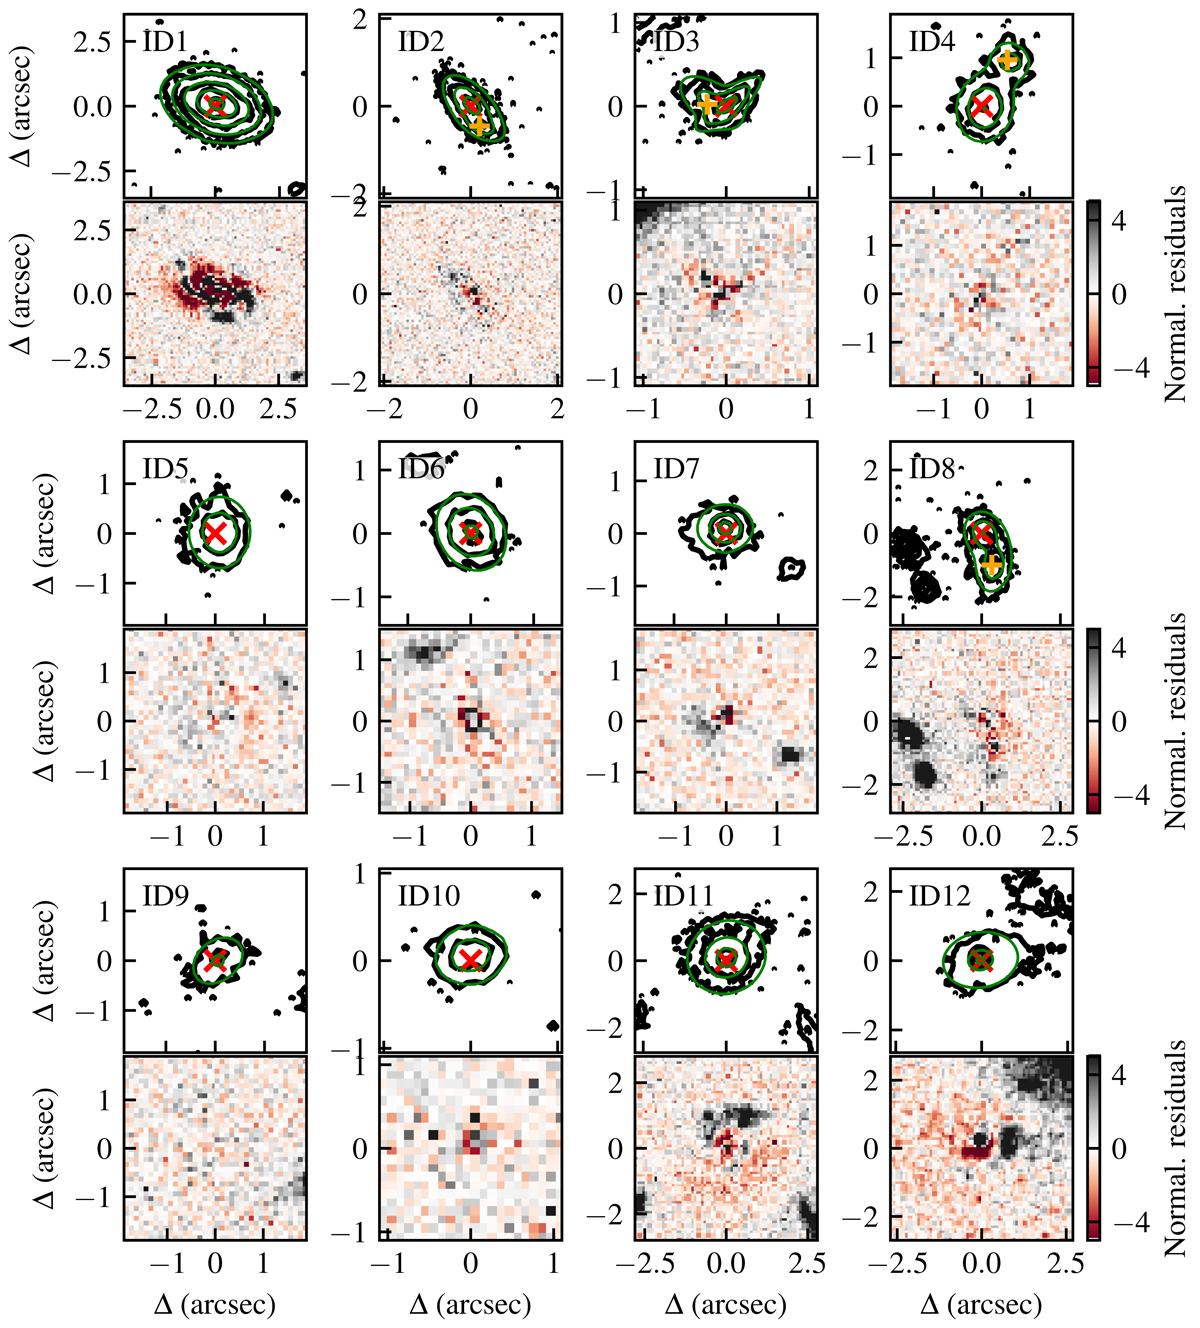
Fig. A.1.
Download original image
GALFIT model and residuals. For each target, we show in the upper panel the contours of the HST data (black) and GALFIT model (green). The levels of the contours are at [3, 9, 27, 81] × RMS. The bottom panel shows the residual normalized to the noise map. The red cross shows the center of the main galaxy and the orange crosses show the center of additional components that were added to the fitting, when necessary.
Current usage metrics show cumulative count of Article Views (full-text article views including HTML views, PDF and ePub downloads, according to the available data) and Abstracts Views on Vision4Press platform.
Data correspond to usage on the plateform after 2015. The current usage metrics is available 48-96 hours after online publication and is updated daily on week days.
Initial download of the metrics may take a while.