Fig. 15.
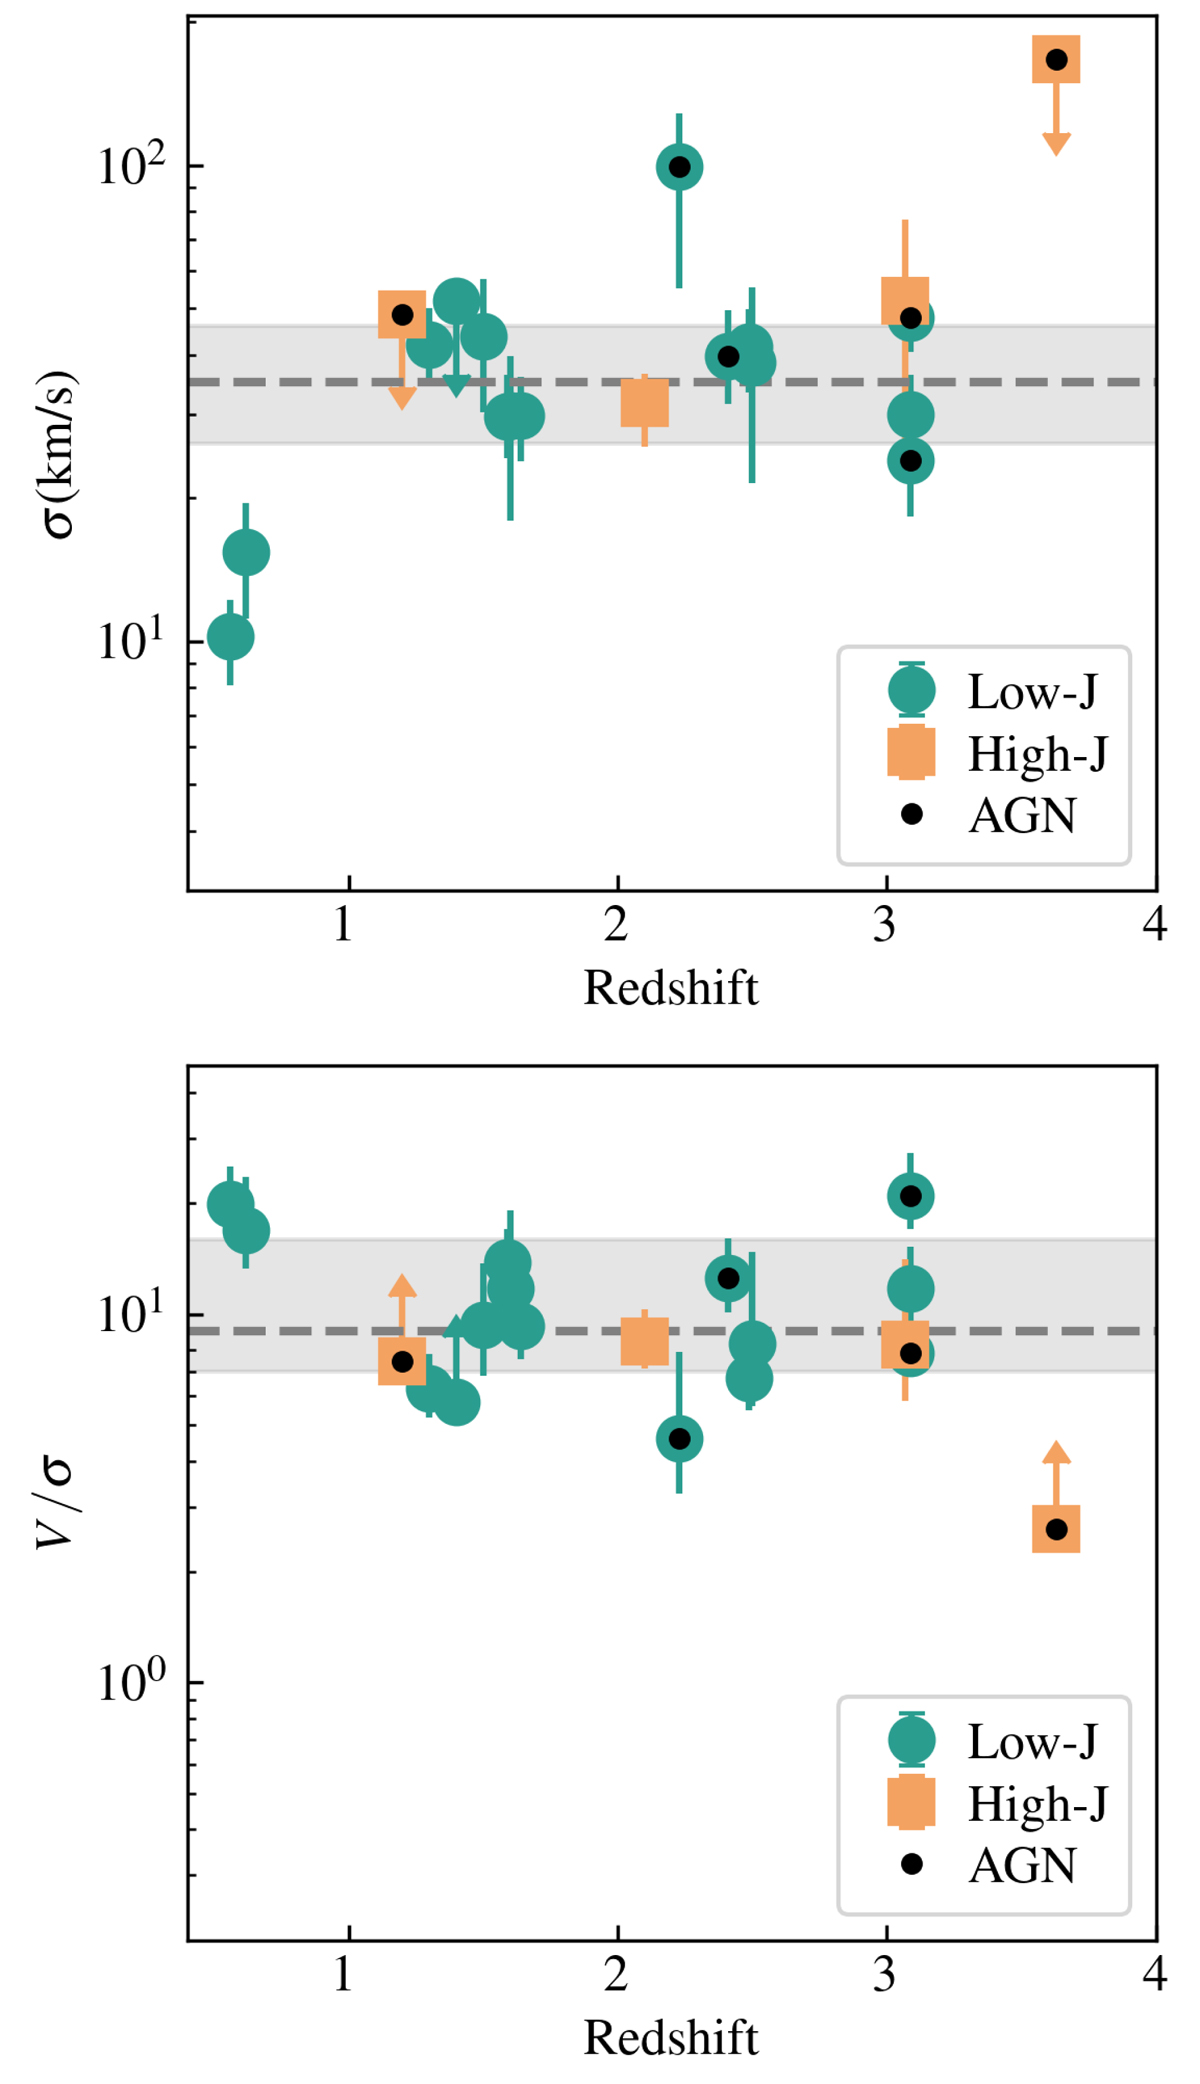
Download original image
Distribution of the ALPAKA disks in the velocity dispersion – redshift plane (upper panel) and rotation-to-velocity dispersion ratio – redshift plane (bottom panel). The values of σm and Vmax/σm (Table 5) are plotted here. The redshifts of ID3, ID6 – 9, and ID19 are shifted by |Δz|≲0.25 for a better visualization of all the data points. Galaxies with kinematics from CO(2-1), CO(3-2) or [CI](3P1 − 3P0) are shown with green circles, while galaxies with CO(5-4), CO(6-5) or [CI](3P2 − 3P1) are shown with orange squares. The dashed gray line (and the gray area) show the median (and the 16th and 84th percentiles) σm and Vmax/σm values for the ALPAKA disks.
Current usage metrics show cumulative count of Article Views (full-text article views including HTML views, PDF and ePub downloads, according to the available data) and Abstracts Views on Vision4Press platform.
Data correspond to usage on the plateform after 2015. The current usage metrics is available 48-96 hours after online publication and is updated daily on week days.
Initial download of the metrics may take a while.