Fig. 9
Download original image
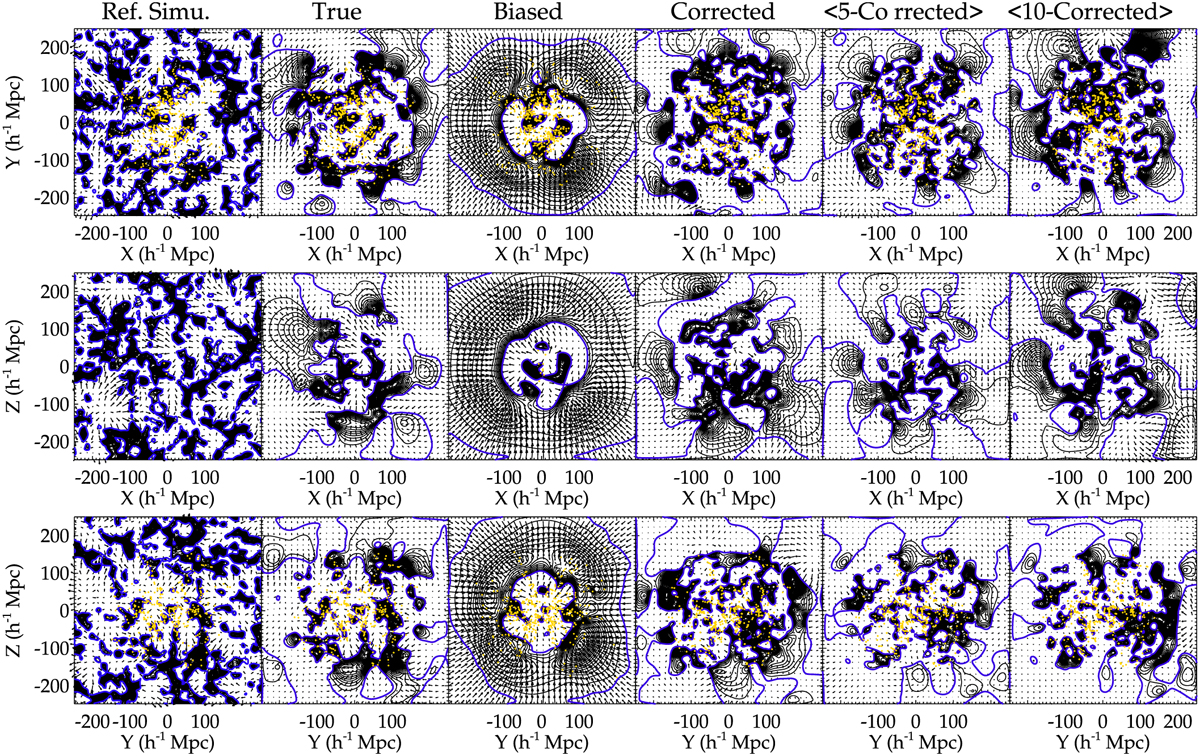
Supergalactic slices of the simulated (first column) and reconstructed (second to sixth columns) density and velocity fields. Contours show the overdensities and arrows indicate the velocities. The blue contours delimit the underdensities from the overdensities. Yellow points show halos constituting the different catalogs. The peculiar velocities of these halos, obtained from distance moduli, are actually used for the different reconstructions.
Current usage metrics show cumulative count of Article Views (full-text article views including HTML views, PDF and ePub downloads, according to the available data) and Abstracts Views on Vision4Press platform.
Data correspond to usage on the plateform after 2015. The current usage metrics is available 48-96 hours after online publication and is updated daily on week days.
Initial download of the metrics may take a while.