Fig. 7
Download original image
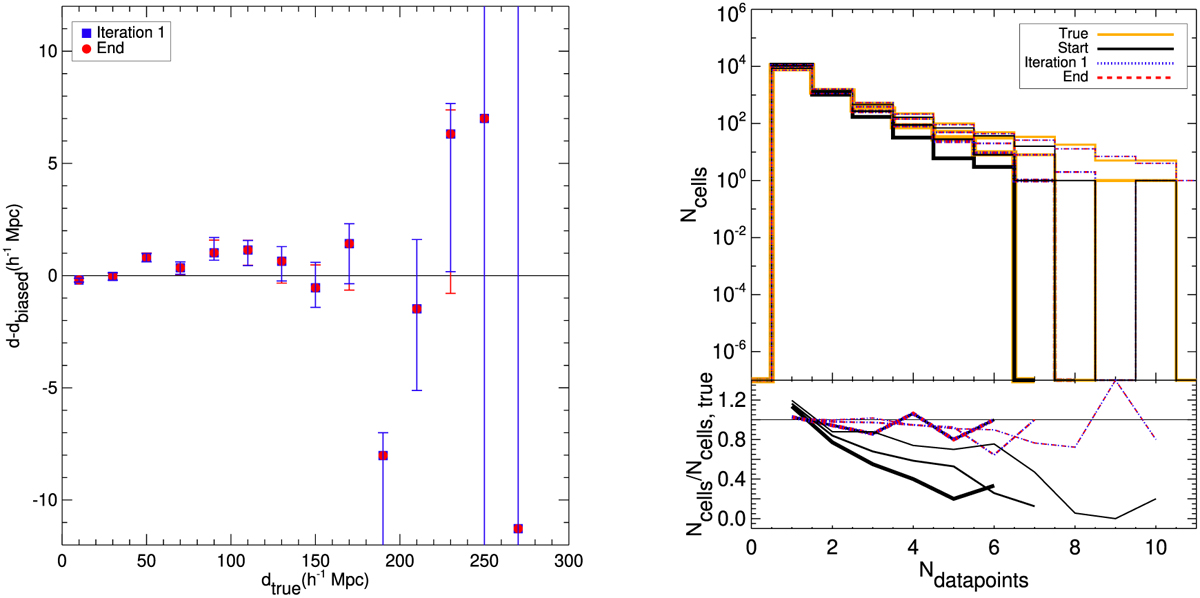
Comparisons of dataset properties. Left: median of the difference between distances obtained from after iteration 1 (filled blue squares) and at the end of the process or corrected (filled red circles) distance moduli and those derived from biased distance moduli as a function of the true distances. Errors on the median are obtained with bootstrapping. New distances tend to be larger than initial ones. This is in agreement with the reduction of the homogeneous Malmquist bias that statistically tends to put objects closer than they are. After bias-minimization of distance modulus catalog, new distances are indeed statistically larger than initial ones derived from biased distance moduli. At large distances, effects of the catalog edges, like sharp cut-off, are preponderant. Top-right panel: histograms of the number of data points per grid cells obtained from true (thick yellow solid line), biased (black solid line), after iteration 1 (blue dotted line) and at the end of the process or corrected (red dashed line) distance modulus catalogs. Grids are built to split the Supergalactic coordinate space uniformly. Since catalogs are not complete, cells with no data point have been removed. The histograms represent a measurement of the clustering. The more clustered the data points in a catalog are, the more data points there can be per grid cells. Bottom-right panel: ratios between the biased (black solid line), after iteration 1 (blue dotted line) and at the end of the process or corrected (red dashed line) histograms and the true one. These right panels show that data points in the biased catalog are statistically less clustered than in the true and corrected ones. This is in agreement with the reduction of the heterogeneous Malmquist bias. Indeed, the latter tends to reduce clustering by statistically scattering objects from high density regions to low ones. The line thickness stands for the grid-cell size. From the thicker to the thinner lines, the cell sizes are ~4.6, 5.5 and 6.9 h−1 Mpc.
Current usage metrics show cumulative count of Article Views (full-text article views including HTML views, PDF and ePub downloads, according to the available data) and Abstracts Views on Vision4Press platform.
Data correspond to usage on the plateform after 2015. The current usage metrics is available 48-96 hours after online publication and is updated daily on week days.
Initial download of the metrics may take a while.