Fig. 6
Download original image
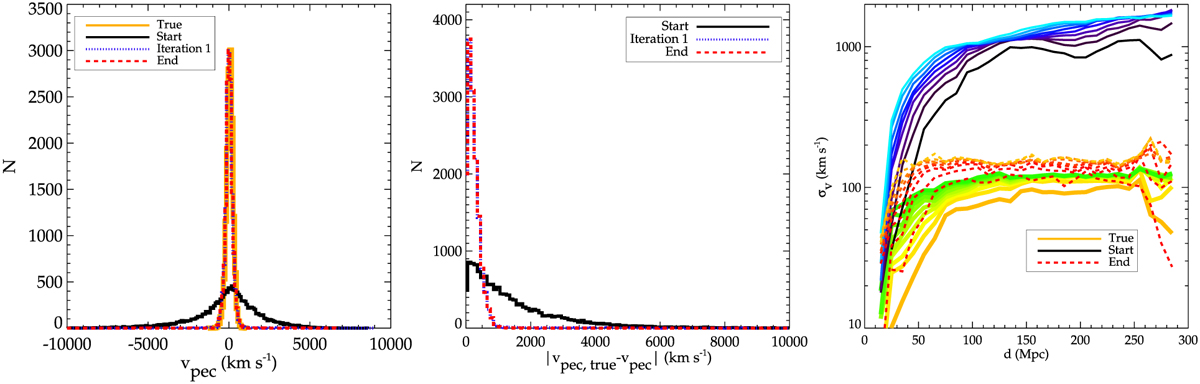
Comparisons of velocity properties in the datasets. Left: true (thick yellow solid line) and biased (black solid line) peculiar velocity distributions vs. those derived from after iteration 1 (blue dotted line) and at the end of the process or corrected (red dashed line) distance moduli. Middle: histograms of errors in absolute value on peculiar velocities derived from before correction, after iteration 1 and after correction distance moduli. Same color and line style codes. Right: local velocity variance in different shape S elongations (one line per elongation) for a catalog free of errors (solid lines with warm colors), with errors (solid lines with cold colors), after applying the algorithm (dashed lines with warm colors). The variance is defined as the standard deviation between peculiar velocities of galaxies belonging to a same, elongated along the line-of-sight, shape S (see exact definition in the text). Shape elongations at given distances are obtained ranging fictively distance modulus uncertainties from 0.2 (orange, red, black) to 1.8 (green, orange, light blue) mag.
Current usage metrics show cumulative count of Article Views (full-text article views including HTML views, PDF and ePub downloads, according to the available data) and Abstracts Views on Vision4Press platform.
Data correspond to usage on the plateform after 2015. The current usage metrics is available 48-96 hours after online publication and is updated daily on week days.
Initial download of the metrics may take a while.