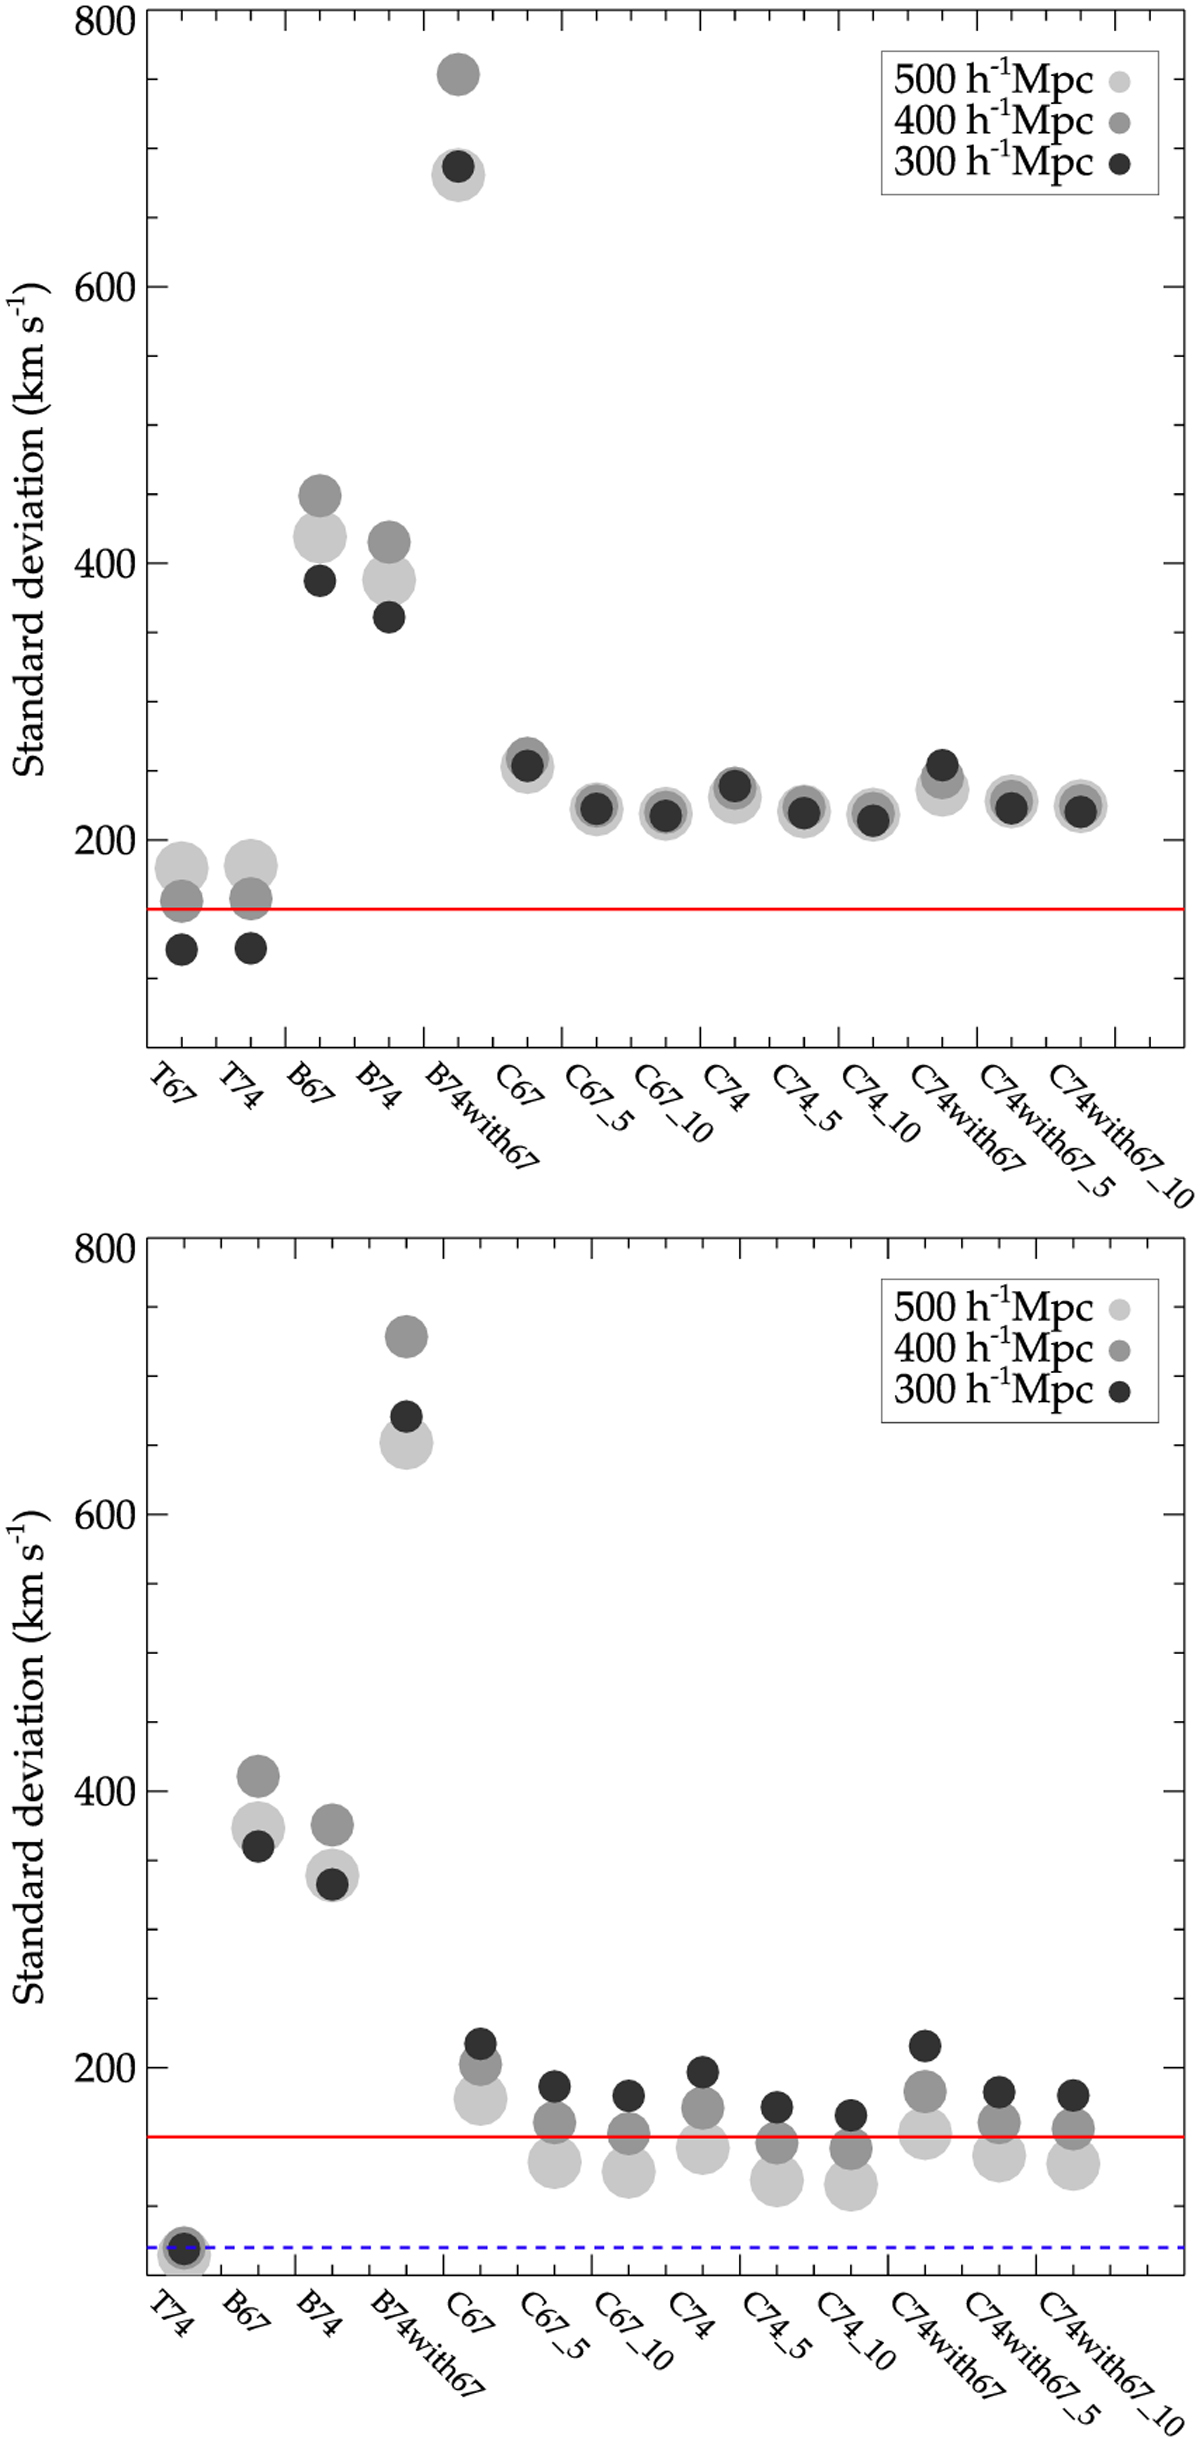
Fig. 15
Download original image
Comparisons between reconstructed velocity fields. Top: variance (filled circles) between the velocity field of the reference simulation and those reconstructed from the different catalogs. Bottom: variance (filled circles) between the reconstructed velocity field obtained with the true catalog T67 and those derived from the other catalogs. Detailed explanations of the different catalogs are given in the text. Names are given as follows: the letter indicates the type - T for True, B for biased and C for bias-minimized; the number gives the Hubble constant value −67 for 67.77 km s−1 Mpc−1, 74 for 74 km s−1 Mpc−1 and 74with67 when assuming 74 km s−1 Mpc−1 but for a 67.77 km s−1 Mpc−1 based true catalog; any additional suffix means that several realizations have been stacked (either 5 or 10). The size and color of the filled circles stand for the sub-box size within which fields are compared. The solid red line stands for the average variance between the reference simulated velocity field and that reconstructed from T67. The dashed blue line shows the average variance between the reconstructed fields obtained from both true catalogs with different H0 values (T67 and T74). Fields reconstructed from the bias-minimized catalogs differ from those obtained with the true catalog by the same amount as the latter differs from the reference field.
Current usage metrics show cumulative count of Article Views (full-text article views including HTML views, PDF and ePub downloads, according to the available data) and Abstracts Views on Vision4Press platform.
Data correspond to usage on the plateform after 2015. The current usage metrics is available 48-96 hours after online publication and is updated daily on week days.
Initial download of the metrics may take a while.